内存监视器 v2.0 (by Chief)
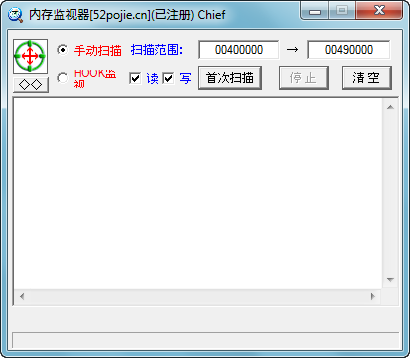
可以查找辅助修改了游戏的哪些地址 比如穿墙 定点等.....
使用方法
选择游戏 点击 首次读取 再开启辅助的某项功能(穿墙等) 点击 再次读取 即可开始查找
还可以监听别人补丁写入数据。
XP系统下测试正常运行,测试监听也没问题。
------------------------------------------------------------------------------
本程序破解仅为测试学习使用,请于下载后24小时之内删除,由此造成的任何损失本人概不负责.谢谢合作.
更新于:2012.10.4 16:12
见附件。
解压密码:Chief
Source: https://www.52pojie.cn/thread-156710-1-1.html
Возможно мальварь, тред на сайте 52pojie был удален: 抱歉,帖子涉嫌存在捆绑木马病毒、广告或其他违规行为,现已删除,查看版规。
Скачать: 内存监视器 v2.0
内存写入监视器 V1.0 (By 缘诚浪子)
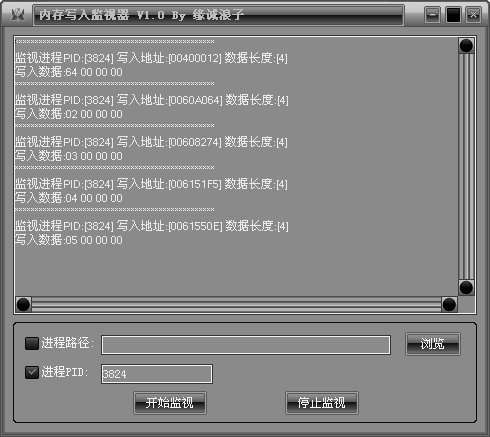
内存写入监视器(易源码)
可以查看指定进程对其他程序的内存写入操作
只需要一个精B
Source: https://bbs.125.la/thread-64996-1-1.html
Скачать: 内存写入监视器 V1.0 (pass: Unpack)
内存写入监视器 v2.0 (by ZzAge)
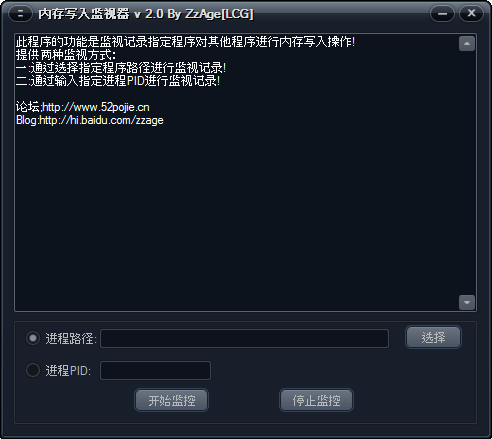
此程序的功能是监视记录指定程序对其他程序进行内存写入操作!
提供两种监视方式:
一:通过选择指定程序路径进行监视记录!
二:通过输入指定进程PID进行监视记录!
论坛;http://www.52pojie.cn
Blog:http://hi.baidu.com/zzage
Source: https://www.52pojie.cn/thread-23593-1-1.html
Source: https://www.52pojie.cn/thread-39492-1-1.html
Source: https://www.52pojie.cn/thread-41830-1-1.html
Use case: https://www.52pojie.cn/thread-173722-1-1.html
Скачать: 内存写入监视器 v2.0 (pass: Unpack)
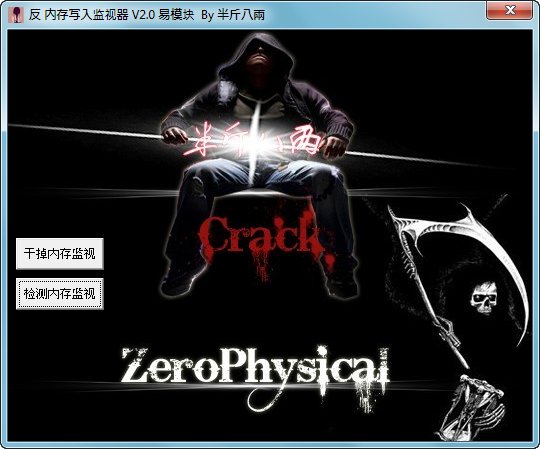
反 内存写入监视器 V2.0 易模块 By 半斤八兩
先前的一个版本不怎么理想, 链接:
http://www.52pojie.cn/thread-154535-1-1.html
(反R0内存监视器(附工具) By 半斤八兩 )
此版本,只要修改监视器的标题,或者按钮的名字,即可反反成功.
现版本,修改标题,修改进程名字,等.都不受影响. :)
注意:本模块,仅仅支持 内存写入监视器 V2.0
Source: https://www.52pojie.cn/thread-157914-1-1.html
Source: https://bbs.pediy.com/thread-153736.htm / https://bbs.kanxue.com/thread-153736.htm
Source: https://www.52pojie.cn/thread-154535-1-1.html
Source: https://www.52pojie.cn/thread-158588-1-1.html
Скачать: 反内存监视集绵 / II
Скачать: 反 内存写入监视器 V2.0 (pass: Unpack)
雨果内存监视器[驱动增强版] v1.1 修复版 支持w7-w11
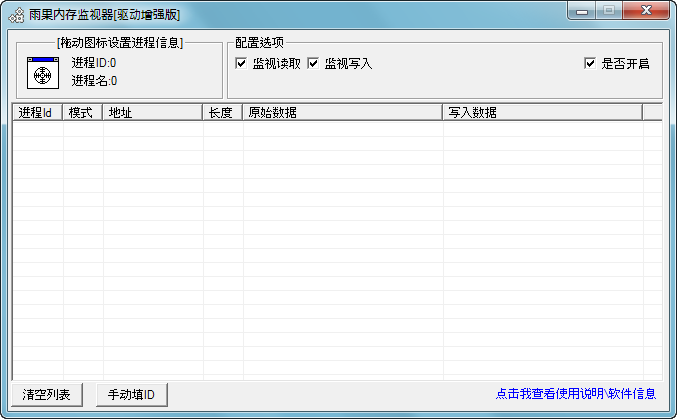
雨果内存监视器[驱动版]ver1.1修复版,"同行技术交流必备工具"
[软件信息]
2023.5.12
1.软件发布,版本号1.0
2023.11.9
1.软件更新,版本号1.1
2.支持最新Win11_23H2版本
3.修复跨进程只能监视读,修复监视不到写操作
预告
1.软件更新,版本号2.0
2.新增监视线程创建
3.新增监视内存属性修改
4.新增监视内存申请
5.新增监视内存释放
[基本使用说明]
一、如果想监视EXE软件
1.拖动图标到"游戏"界面
2.选择要监视的配置,开启监视
二、如果想监视DLL类型软件
1.拖动图标到"游戏"界面
2.选择要监视的配置,开启监视
三、如果你想监视全局,左下角点击进程ID按钮
1.进程ID填写为0,表示监视全局
2.选择要监视的配置,开启监视
[可能遇到的问题]
A:为什么我监视不到数据?
B:因为本工具只监视系统API级调用,如果使用汇编写入的数据监视不到,比如DLL注入,可能直接用汇编写入数据
A:如果目标程序没有窗口怎么办?
B:左下角有个按钮,可以选择手动填写进程ID
A:为什么驱动加载失败?
B:本工具只支持64位w7-w11,不支持w8,不支持32位系统
C:可能你的电脑上拥有杀毒软件被拦截,或者系统开启内核隔离机制
<源码+内存监视器+调用例子>
Source: https://www.52pojie.cn/thread-1854589-1-1.html
Скачать: 雨果内存监视器 v1.1
NoVirusThanks WriteProcessMemory Monitor v1.5.0.0
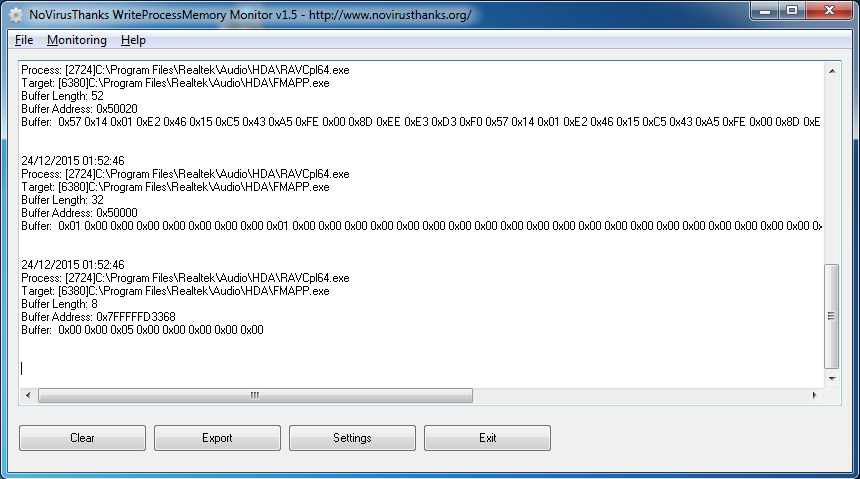
NoVirusThanks WriteProcessMemory Monitor - is a Windows OS utility designed solely to monitor processes in the system that write to other process’ virtual address spaces. Malware often uses such techniques in order to write payload stubs to a foreign process to hook an API, load a malware DLL etc. ntdll!NtWriteVirtualMemory is hooked in order to achieve the desired logging functionality in usermode. For your information, we have created WPMSvc, a service-only version.
NoVirusThanks WriteProcessMemory Monitor displays the caller process and target process filenames as well as their respective process identifiers are shown along with the size of the buffer written to the process and the actual contents represented in hexadecimal of the buffer. The location of the written memory is also listed in hex for run-time reverse engineering convenience.
WriteProcessMemory Monitor can easily be integrated into malware or rootkit test environments to help the security researcher reverse analyze a piece of malware alongside other powerful tools, such as NoVirusThanks Ring3 API Hook Scanner, NoVirusThanks Stream Detector and NoVirusThanks DLL UnInjector.
Changes and Fixes:
[23-12-2015] - v1.5.0.0
+ Improved logging of API call events
[21-11-2015] - v1.4.0.0
+ Improved support for Windows 10
+ Improved the main program interface
+ Added session end handling when rebooting or powering off the PC
+ Added option to save events to a custom log folder
+ Added command-line parameter to hide the main program's interface (-hidegui)
+ Minor fixes and optimizations
File Version 1.5.0.0
Last Updated 23 December 2015
Category Malware Analysis
License Type Freeware
Operating System Windows All (32-bit / 64-bit)
Homepage: http://www.novirusthanks.org/product/writeprocessmemory-monitor/
Homepage: http://www.novirusthanks.org/products/writeprocessmemory-monitor/
MalwareTips Forums: https://malwaretips.com/threads/weve-launched-appsvoid-the-new-place-for-our-software.114043/
Wilders Security Forums: https://www.wilderssecurity.com/threads/weve-launched-appsvoid-the-new-place-for-novirusthanks-software.445409/
Скачать: WriteProcessMemory Monitor v1.5.0.0
GDIView v1.26
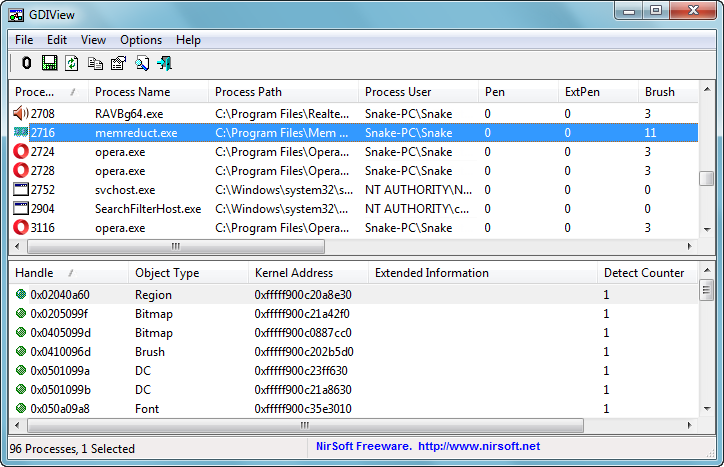
GDIView - is a unique tool that displays the list of GDI handles (brushes, pens, fonts, bitmaps, and others) opened by every process. It displays the total count for each type of GDI handle, as well as detailed information about each handle.
This tool can be useful for developers that need to trace GDI resources leak in their software.
System Requirements
This utility can work on Windows 2000, Windows XP, Windows Server 2003, Windows Vista, Windows 7/2008, Windows 8, and Windows 10. (Earlier versions of Windows are not supported). there is also x64 version available as a separated download.
Known Limitations
On 64-bit systems - GDIView cannot display extended information of 32-bit processes.
Using GDIView
GDIView doesn't require any installation process or additional DLLs. Just copy the executable file (GDIView.exe) to any folder you like and run it.
The main window has 2 panes:
• The upper pane displays the GDI handles count for each process.
• The lower pane displays all GDI handles of the selected process in the upper pane.
The Upper Pane
The upper pane of GDIView displays counters of GDI handles for every process in your system.
You can view the counters in 3 modes:
• Show Counters Only (F2): Displays only the total counters of GDI handles
• Show Counters + Changes (F3): Displays the total counters of GDI handles, as well as the number of handles added (positive value) or released (negative value) since the last counters reset (F8).
• Show Changes Only (F4): Displays the number of handles added (positive value) or released (negative value) since the last counters reset (F8).
The counters are updated according to the interval that you select in Options->Auto Refresh.
The Lower Pane
The lower pane of GDIView displays the details of all GDI handles of the selected process in the upper pane.
For each handle, the following information is displayed:
• Handle: The handle value of the GDI resource.
• Object Type: Bitmap, Brush, Pen, DC, and so on...
• Kernel Address: The memory address in Windows Kernel that contains the data structure of this handle. Regular Windows application cannot read from this address, only device drivers can access it. However, you can view the content this memory by using WinDbg in kernel debugging mode.
• Extended Information: Displays more information for brushes (color and style), pens (style/color/width), fonts (font name/width/height/weight), and bitmaps (width/height/bits per pixel).
By default, displaying the extended information is disabled. You can enable it by selecting 'Display Handle Extended Information' from the Options menu. Be aware that extracting the extended information is more aggressive than the regular mode, so it's recommended to use it only when you really need it.
'GDI Total' and 'All GDI' columns
The 'GDI Total' column (a new column added on v1.05) displays the total number of all GDI handles found in the GDI table for the specified process. This means that 'GDI Total' column display the sum of the following columns: Pen, ExtPen, Brush, Bitmap, Font, Palette, Region, DC, Metafile DC, Enhanced Metafile DC, and Other GDI.
The 'All GDI' value is taken from Windows API call (GetGuiResources), and it usually contains a value larger than 'GDI Total', probably because it also counts some internal kernel GDI objects that are not included in the GDI objects table of the process.
Notice: If you have a problem that the 'All GDI' value is increased, while there is no leak with the other GDI values, it means that you probably have a leak in the creation of icons or cursors (Icons and cursors are created without destroying them later).
Homepage: https://www.nirsoft.net/utils/gdi_handles.html
Скачать: GDIView v1.26
GdiChecker v1.1.9.13
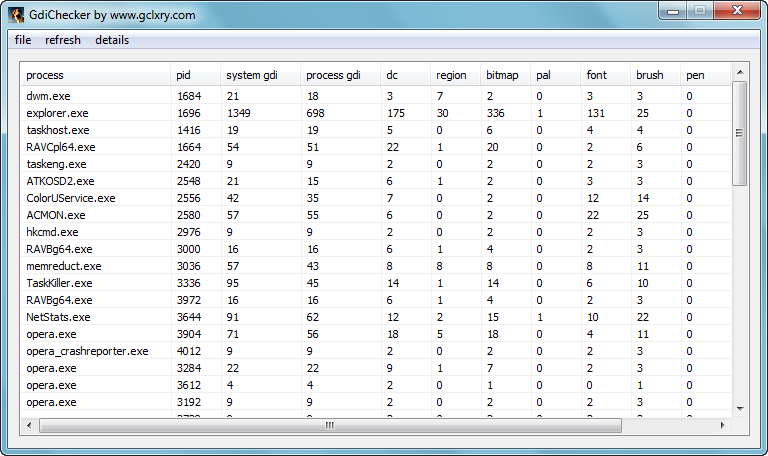
GDI泄漏调试工具——GdiChecker
前几个月一直在做GDI泄漏相关的工作。
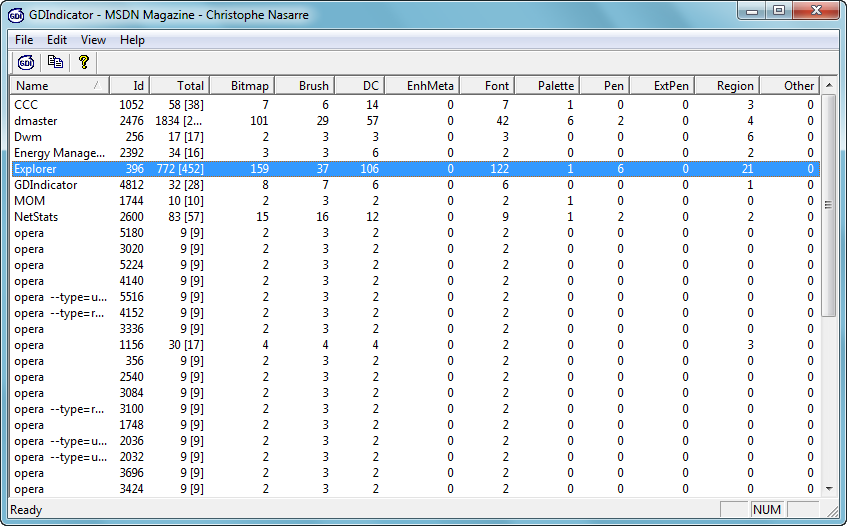
相比于内存泄漏,有很多成熟的工具去检测。但是在我定位gdi泄漏之初,没有什么好用工具。基本办法的是通过任务管理器看某个进程gdi数量的变化,高级一点的是用GDIView这个程序去查看进程各种gdi类型的数量变化,可以进一步定位出是哪种gdi在泄漏,缩小范围。另一个有用的工具是GDIndicator,它可以注入到目标进程,查看gdi句柄对应对象的详细情况。比如显示出bitmap,icon,dc里面内容的样子。
显示某个gdi对象的详细信息这个功能非常有用,很多时候你就可以根据gdi对象的详情就知道是哪种资源在泄漏,哪个图片,哪种dc或者是哪种字体。还有种情况,假如第三方dll造成你程序gdi的泄漏,即使你知道某种类型的gdi正在泄漏,但是你review你自己的代码却发现对应gdi资源管理没有问题。如果你知道gdi的对象的详情,比如某个位图的样子,你就发现这可能是输入法注入进来造成的gdi泄漏。
但是GDIView和GDIndicator都有各自的缺点。GDIView分32位和64位两个独立的exe,并且不能查看到某个gdi对象的详情。而GDIndicator仅支持xp,win7下面无法使用。
我写了一个GdiChecker的程序,综合了GDIView和GDIndicator的优点。它可以同时支持显示32位和64位进程gdi的各种类型GDI数量,又可以注入到进程里面显示gdi的详情。
点击refresh菜单就可以刷新当前系统进程的GDI数量情况。
如果你想要查看某个进程GDI的详细情况,则选中进程,点击details菜单,就可以看到详细情况。
目前我已经把这个工具用wtl重写了一边,在github上开源了:https://github.com/plxaye/GdiChecker
Homepage: http://blog.gclxry.com/gdi泄漏调试工具-gdichecker/
GitHub: https://github.com/gclxry/GdiChecker
Скачать: GdiChecker v1.1.9.13
Bear v1.60
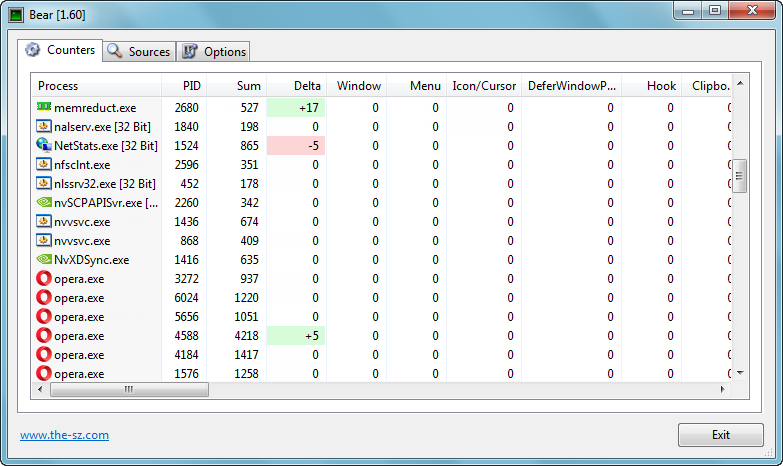
Bear - See GDI/User Object usage of all processes
Track down GDI and User handle leaks. You can identify which application leaks GDI/User handles. In the details view, you can see all the properties of the handles. For bitmaps, icons and cursors you see and save the real image.
On 32 and 64 Bit versions of Windows 10, Windows 8.1, Windows 8, Windows 7, Vista, Server 2012, Server 2008, Server 2003, XP, 2000 and NT4, Bear displays the usage of
• All GDI Objects [hDC, hRegion, hBitmap, hPalette, hFont, hBrush]
• All User Objects [hWnd, hMenu, hCursor, SetWindowsHookEx, SetTimer and some other stuff]
• Handles
• Memory pages count and size [LoadLibrary() and LoadLibraryEx(LOAD_LIBRARY_AS_DATAFILE)]
On Windows 98 and Windows 95, Bear displays the usage of
• All GDI Objects [hDC, hRegion, hBitmap, hPalette, hFont, hBrush]
• GDI, System and User Resources
Handle Details
A double click on a process opens the details view. Each GDI/User object is shown with a description. Make a right click onto Bitmaps, Icons and Cursors to save them.
Delta
Changes are displayed in green and red to easily spot the differences.
Logging
Enable logging to a CSV file to trace changes over time.
If a specified handle count limit is reached, a notification can be send. Using Email, PubNub.com or logfile.
Install using package managers:
> winget install --id the-sz.Bear -e --force
> choco install bear.portable -y --ignore-checksum
History:
Version Change
1.60 Cleanup code fixed
1.59 High DPI support improved
1.58 High DPI support improved
Homepage: https://www.the-sz.com/products/bear/
Homepage: https://the-sz.com/products/bear/
Скачать: Bear v1.59
Скачать: Bear v1.60
gdi_handle_study v1.0
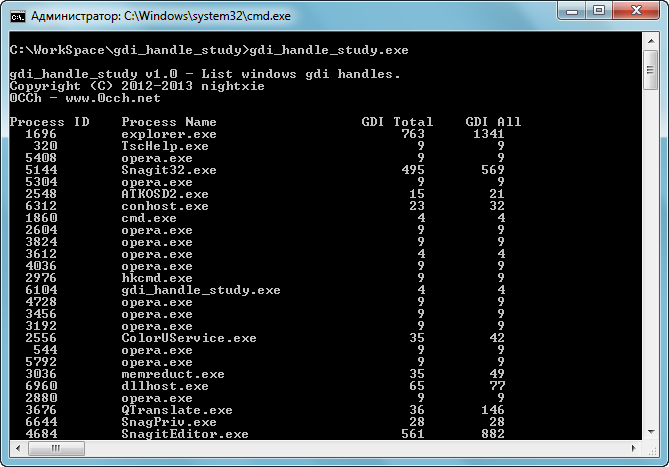
gdi_handle_study —— 查看进程GDI资源情况的工具
gdi_handle_study 是一个用于查看进程中gdi句柄资源的工具。可以用于监控gdi资源是否泄露,已经对gdi资源的使用情况。使用方法非常简单:
usage: gdi_handle_study.exe [-c] [-v [-f <filter>]] [processname|pid]
processname List GDI handles loaded by process (partial name accepted)
pid List GDI handles associated with the specified process id
-c Show GDI count information.
-v Show GDI handle information.
-f Filter the GDI handle type.
值得注意的是,GDI Total和GDI All的区别在于,GDI Total统计出来的数量,是通过工具本身枚举可统计GDI资源后得出统计值,而GDI All是通过系统API直接获得的值,有些的情况下,GDI Total的值是小于GDI All的值的。这种情况可能因为某些GDI资源是系统保留的。另外一个要注意的是,如果要显示所有进程的gdi情况,需要有管理员权限运行该工具。
processname和pid参数能让我们指定需要查看的进程名或者进程ID。参数-c能查看更为详细的gdi资源的统计情况。
-v参数是用来查看更为详细的GDI资源信息,其中就包括额资源的句柄,资源的种类以及资源的内核对象地址。
最后工具还能利用-f filter,来查看想看到的资源情况。
Homepage: http://0cch.net/wordpress/?p=238
Homepage: http://0cch.com/ntinternals/2013/05/04/gdi_handle_study-e6-9f-a5-e7-9c-8b-e8-bf-9b-e7-a8-8bgdi-e8-b5-84-e6-ba-90-e6-83-85-e5-86-b5-e7-9a-84-e5-b7-a5-e5-85-b7.html
Homepage: https://0cch.com/2013/05/04/gdi_handle_study-e69fa5e79c8be8bf9be7a88bgdie8b584e6ba90e68385e586b5e79a84e5b7a5e585b7/
Скачать: gdi_handle_study v1.0
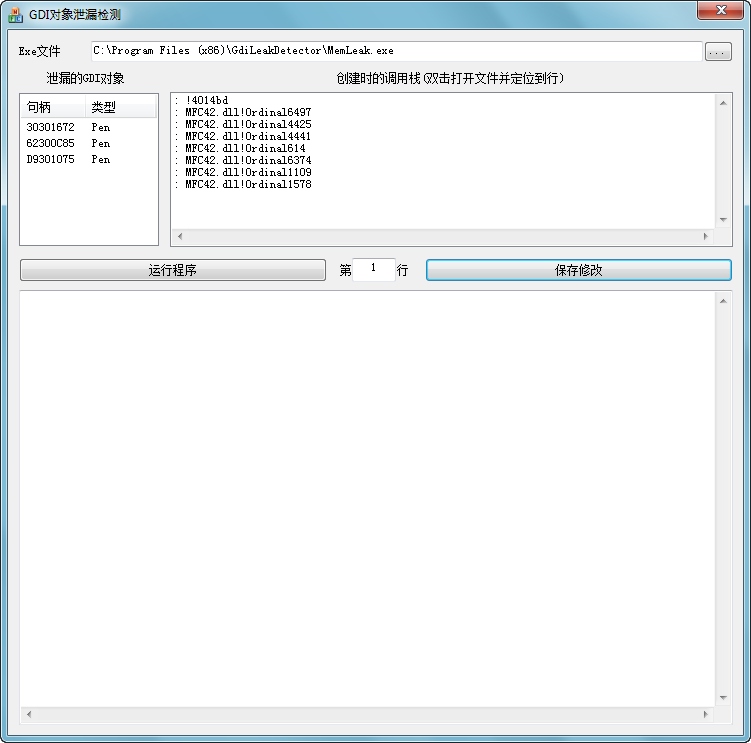
GdiLeakDetector v1.0
如何检测GDI资源的泄漏。
内存泄漏,MFC提供机制去检测,但是GDI资源的泄漏,确实无法通过基础机制去检测的。
这里提供一个检测和定位GDI泄漏的程序
介绍:
一个容易使用,强大,高效检测和定位GDI泄漏的工具。它可以在visual studio中使用
关于工具的机制:
工具有两个部分GdiLeakDtector.exe和GdiSpy.dll
GdiLeakDtector.exe是一个特殊的调试器,它在debug模式下载入进程,并将GdiSpy.dll注入调试程序。GdiSpy将截获GDI的调用和释放到日志。这样,就可能发现泄漏的资源。它有误报的可能性。因为在程序有可能在GdiSpy.dll释放后,在释放GDI资源。不过这个误报很容易被发现。不是个大问题。
Memleak.exe 是一个内存泄漏的测试程序。
Homepage: http://cppblog.com/alantop/archive/2007/08/30/31204.html
Homepage: http://www.cppblog.com/alantop/archive/2007/08/30/31204.html
CodeProject: https://www.codeproject.com/Tips/20264/GDI-Leak-Detector-A-special-debugger-to-detect-and
GitHub: https://github.com/deping/GdiLeakDetector [d]
Скачать: GdiLeakDetector v1.0
GDIndicator v1.0 (by Christophe Nasarre)
Dependent Dlls can be taken here: Missing Microsoft DLLs (mfc70.dll and msvcr70.dll) [?] / [d]
Source: http://msdn.microsoft.com/msdnmag/issues/03/01/GDILeaks/default.aspx
Source: https://learn.microsoft.com/en-us/archive/msdn-magazine/2003/january/detect-and-plug-gdi-leaks-with-two-powerful-tools-for-windows-xp
Скачать: GDIndicator v1.0
HeapMemView v1.05
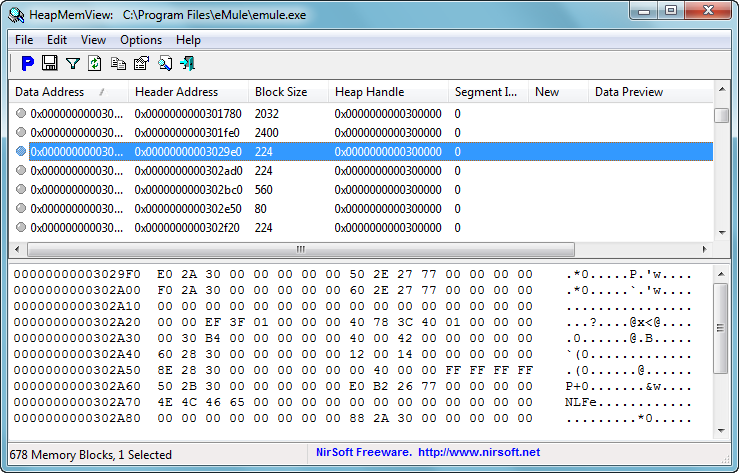
HeapMemView - is a small utility that allows you to view the content of all memory blocks allocated in the heap of the process that you select.
This tool can be useful for developers that need to trace memory leaks in their software.
System Requirements
This utility can work on Windows 2000, Windows XP, Windows Server 2003, Windows Vista, Windows 7, and Windows 8 (Earlier versions of Windows are not supported). there is also x64 version (for Vista x64) available as a separated download.
Using HeapMemView
HeapMemView doesn't require any installation process or additional DLLs. Just copy the executable file (HeapMemView.exe) to any folder you like, and run it. After you start HeapMemView, you have to select the process that you want to inspect.
The main window of HeapMemView has 2 panes:
• The upper pane displays the list of memory blocks allocated in the heap of the process the your selected.
• The lower pane displays the contant of the memory block that you select in the upper pane.
Tips For Using HeapMemView
• In order to decrease the number displayed memory blocks and to improve the performances, HeapMemView filter all memory blocks with size smaller than 80 bytes. You can change this default filter by using the Memory Blocks Filter window (F8).
Be aware that without the 80 bytes filter, you may get a lots of small and meaningless memory blocks, and the loading process will be pretty slow.
• Each time that you press F5, the newly added memory blocks are marked with '*', as well as they are painted with pink color. You can clear the 'new' flag by using the 'Clear New Memory Blocks Mark' option (F6).
• In addition to the memory bytes displayed in the lower pane, You can view a sample of the memory bytes in the table of the upper pane - under 'Data Preview' column. In order to enable this feature, select Options->Data Preview Mode->ASCII or Hexadecimal. By default, the first 32 bytes of the memory block will be displayed. You can modify the default settings in Advanced Options window.
• You can export all heap memory blocks to binary files for inspecting them in the future, by selecting all memory blocks in the upper pane, and then using 'Export Memory Data To File' option (Ctrl+E)
• The 'Heap Handle' value is the handle returned by HeapCreate or GetProcessHeap API functions. The 'Data Address' value is the memory address returned by HeapAlloc API.
• When a program allocates heap memory with C/C++ memory functions (malloc or new keyword), you may see some header bytes preceding the real allocated memory data.
Homepage: https://www.nirsoft.net/utils/heap_memory_view.html
Скачать: HeapMemView v1.05
勇芳_内存编辑器 v3.2.0
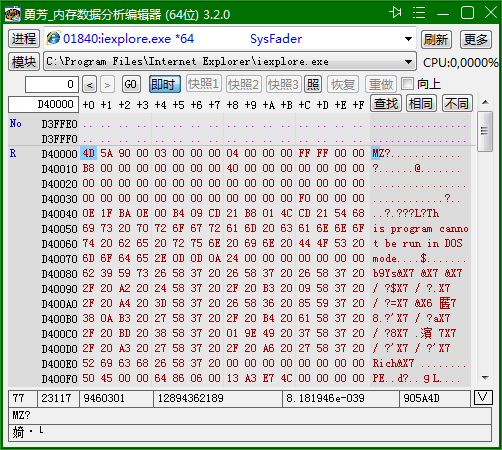
能直接查看和修改进程内存数据的软件。就是说能查看和修改正在运行的软件或游戏的内存数据,可用在破解软件,修改软件或游戏数据之用;适合电脑老鸟使用,新手必须学习必要的基本知识后才可,
文件清单:
内存分析.exe ..........软件主程序,不可缺少
勇芳软件_在线自动更新.exe.......在线更新主程序和提示有新的勇芳用,
由主程序调用,不能单独使用。,可以删除
更新数据.ini ...................在线更新生成的配制文件,可以删除
知识基本:(如果看不懂,那去学基本的基本电脑知识后再来)
1,打开一个软件后,系统为此分配一个进程号,我们称进程ID,软件可以有很多窗口,但只有一个进程
2,软件在大多数地方都是用16进制数的,必须先知道什么是16进制数
3,每个已经打开的软件,以后称其为进程,系统都分配给其 2GB的内存空间,不管你的电脑有多少内存,都是如此,
4,电脑上的所有一切存在,都是数字,不管是硬盘上的,内存中的,都如本软件显示的那样,一堆数字而以
5,管理这些数字,我们要为其标上地址,每个进程的地址范围: 0x10000~~0x7FFEFFFF 2 GB 减去至少192 KB进程的地址空间
6,每个数字的范围,是 0~255 用16进制 00 ~ FF 表示,我们不要管为什么,只要知道就行
7,每个数字我们称为 1个字节(B);1024个字节称为 千字节(KB);1024千字节称为兆字节(MB);1024MB称千兆字节(GB),在很多地方,我们都不用中文,用代号表示的:B KB MB GB
8,为了表示更大的数,我们要用2、4、8个字节表示一个数,浮点数是有小数的数,其他的都是整数
9,大多的软件或游戏都用4个字节表示一个数,如游戏中的血量,魔法量等,绝大多数是整数
软件使用简介
1,在软件中间显示的是,进程数据,在基的左边为数据的地址,右为ASCII字符
2,软件的主要作用就是搜索或查找对你有用的数据,还可修改数据,达到你的目的
3,如果显示出数据为红色,表示这个区域的内存内容是不能修改的,点【更多】按钮,将其改为读写,才可修改
4,如果显示出数据为 .. ,表示这个地方系统没有分配给进程使用,所以不能使用。
5,快照功能,能将内存复制下来,再用【相同】或【不同】按钮,以此查找出内存中变化的数据
6,进程可以使用公用的内容,称其为模块,就是使用DLL,会编程的人都知道,本软件能显示进程使用的所有模块,点击模块名,显示其在内容中的位置。
7,本软件不会自动刷新进程列表,当新打开软件后,需要你自己点【刷】按钮刷新列表
8,【暂停】会将进程挂起,再点就恢复,有时会用到他,让软件暂停运行。
9,【搜索】功能如同游戏修改器软件一样操作,只是提供更多的专业功能而以
10,注:8字节整数受VB编程的限制,显示的数应该是要*10000的整数,输入数时要除以10000才对。
11,更多方法依靠你自己探搜。。。。。。。。。
本软件是用Visual Basic 6.0 所编,让VB爱好者们知道,没有做不到,只是想不到。VB易学、开发周期短、调试代码最方便,但是限制也多,特别是做这样的软件,如8字节整数,想要突破限制,需要大家共同努力。
Homepage: http://www.yfvb.com/soft-37.htm
Скачать: 勇芳_内存编辑器 v3.1.2
Скачать: 勇芳_内存编辑器 v3.2.0
ProcMem v1.0
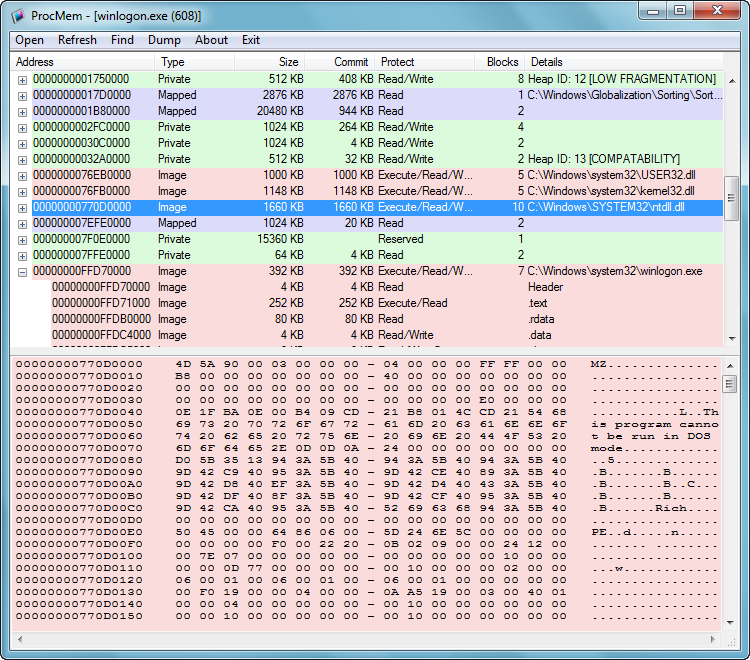
ProcMem —— 进程内存查看工具
ProcMem是一个进程内存的查看工具,他可以显示进程中的内存分配情况,以及内存大概的用途,并且Dump指定的内存模块。
ProcMem并不是实时监控目标进程的内存情况,而是对内存情况作了一次快照和统计,并且显示出来。所以想看到进程最新的内存状态,可以点击Refresh菜单。
工具上半部分就是显示的目标进程的内存分布情况,以及一些细节信息。这里必须要谈到一点,Windows的标准控件中没有TreeList,对我这个写100个程序99个没有界面的人来说,自绘这个东西差点没要了我的命。
工具的下半部分用来显示TreeList选中项的内存情况,十六进制表示。值得注意的是,这里只会显示选中内存头个PAGE_SIZE大小的内存情况。如果想查看该项内存的全部情况,可以使用Dump功能,把内存Dump下来,然后用WinHex这样的工具查看,这个简单的内存显示区,只是为了提供一个预览功能而已。
值得一提的是,菜单Find,不是用来查找下方十六进制内存显示的内容,而是用来查找TreeList中的项目。例如想找到有关ntdll的内存区域,可以在查找框中输入ntdll,这样就可以定位如图所示的项目了。
这个工具是我花了大半周的业余时间弄的,时间比较仓促,不可避免的可能会有些bug。如果你刚好用上了这个工具,而且发现了bug,不妨通过邮件联系我(邮箱地址见About Me页面)。
下载ProcMem(包括32和64位版本)
Homepage: http://0cch.net/wordpress/?p=226
Homepage: http://0cch.com/debugging/ntinternals/2013/04/21/procmem-e8-bf-9b-e7-a8-8b-e5-86-85-e5-ad-98-e6-9f-a5-e7-9c-8b-e5-b7-a5-e5-85-b7.html
Homepage: https://0cch.com/2013/04/21/procmem-e8bf9be7a88be58685e5ad98e69fa5e79c8be5b7a5e585b7/
Скачать: ProcMem v1.0
MemMapView v1.0
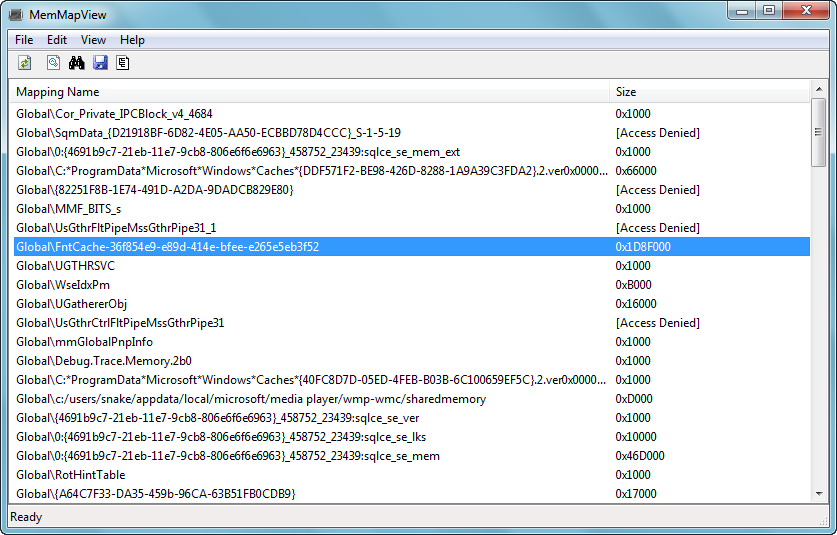
MemMapView —— 查看共享内存映射的工具
MemMapView是一个查看Named Shared Memory的工具,它能够枚举系统中的命名共享内存的名称,并且浏览其数据。
Homepage: http://0cch.net/wordpress/?p=547
Homepage: http://0cch.com/debugging/ntinternals/tips/2015/04/18/memmapview-e6-9f-a5-e7-9c-8b-e5-85-b1-e4-ba-ab-e5-86-85-e5-ad-98-e6-98-a0-e5-b0-84-e7-9a-84-e5-b7-a5-e5-85-b7.html
Homepage: https://0cch.com/2015/04/18/memmapview-e69fa5e79c8be585b1e4baabe58685e5ad98e698a0e5b084e79a84e5b7a5e585b7/
Скачать: MemMapView v1.0
PTView v1.0 by VollRagm
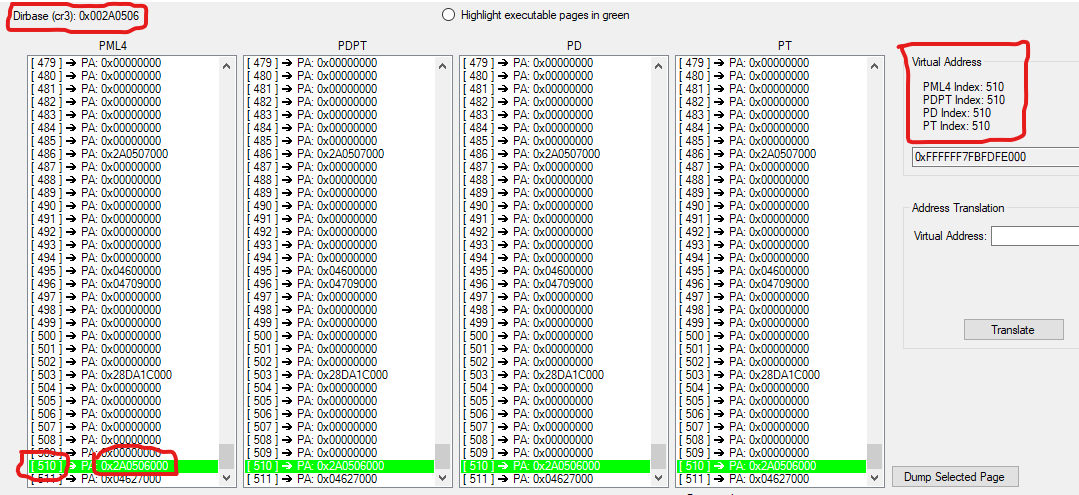
PTView
This utility allows you to inspect a Windows processes Page Tables live. You can browse through them in a GUI and dump the physical pages they point to, as well as translate virtual to physical addresses and get the virtual address to a PTE.
Usage
You will have to load the driver before running the client. I recommend loading the Driver normally in test mode, but it can be mapped as well, just make sure the first argument is the driver base and the second argument is NULL. After opening the client, select a process and start browsing its page tables!
Key features
• Browse Page Tables of Processes, including system processes
• Highlight different types of Pages
• Dump a physical page
• Get the virtual address that leads to the current selection
• Translate a physical address to virtual address with visualization
• Get information on a Page table entry
• Support for Large Pages
Things worth trying out
1.Dump the PML4 itself over its auto-entry (self-reference):
Every PML4 keeps an entry that has the PML4's address as PFN itself. This entry is at a fixed index, that Windows nowadays sets randomly during boot. If this entry is selected the PDPT actually is the PML4 itself again. If you select it in the PDPT again, the PD also is the PML4 again. If you continue that until the end, the PT will be the PML4, and you will be able to use the PML4 auto-entry to dump the PML4 itself or get its virtual address. Note that this address only is valid in the selected processes context.
2.Watch Windows Memory manager map pages, that have been paged out to disk:
Get the virtual address of an unused loaded module in the process. Enter it in the Virtual Address textbox and translate it. Chances are that the PTE of that VA or the subsequent PTE's PFNs is 0x0. Now access the virtual address using a Debugger or Memory viewer, like Cheat Engine, and you will see how it raises a page fault, causing Windows Memory Manager to map the pages live.
UnKnoWnCheaTs: https://www.unknowncheats.me/forum/anti-cheat-bypass/487981-ptview-browse-page-tables-windows.html
GitHub: https://github.com/VollRagm/PTView
Скачать: PTView v1.0
Kernel Pool Monitor v1.0 (by Pavel Yosifovich)
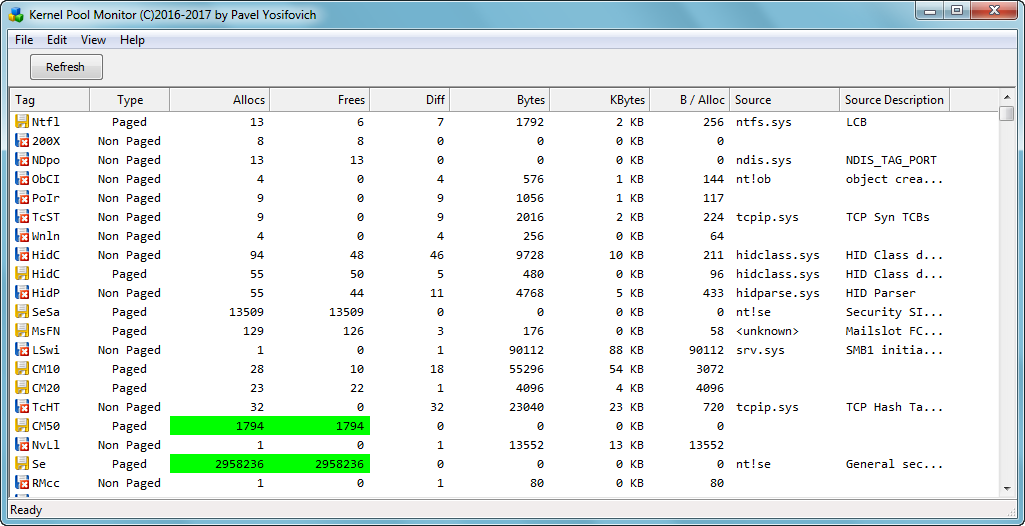
PoolMonX
A GUI version of the classic PoolMon tool
Source: https://github.com/zodiacon/PoolMonX
--------------------------------------------
PoolMonXv2
Kernel Pool Monitor PoolMonX shows kernel pool allocation with tags, number of allocations, frees and consumed memory.
Source: https://github.com/zodiacon/PoolMonXv2
--------------------------------------------
PoolMonXv3
Monitor Kernel pool allocations tags
Source: https://github.com/zodiacon/PoolMonXv3
--------------------------------------------
PoolMon Microsoft [?] / [?]
Скачать: Kernel Pool Monitor v1.0
Скачать: Kernel Pool Monitor v2.0
Скачать: Kernel Pool Monitor v3.0
Memory Map Viewer v0.2 (by Pavel Yosifovich)
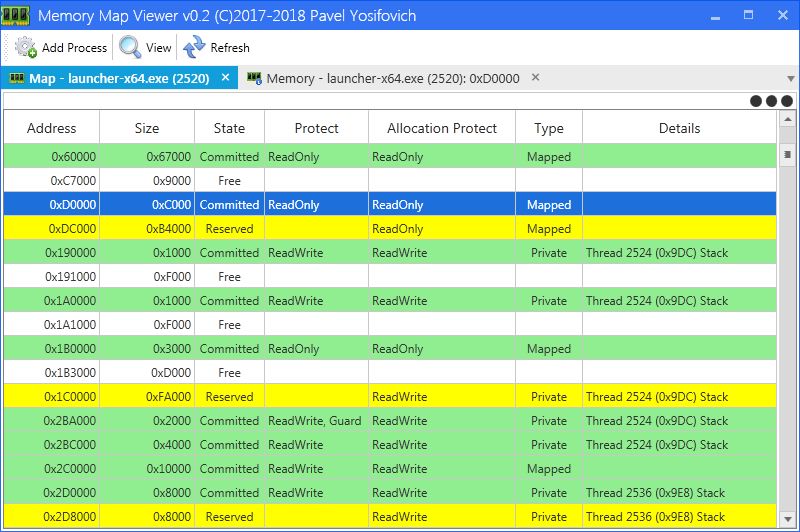
Memory Map Viewer - shows the memory map of selected processes (similar to VMMap from SysInternals), but uses a driver to look inside protected and minimal processes. It also shows the actual data.
Changed the driver to be test signed only. Must run on a system that is in test signing mode (bcdedit /set testsigning on) and reboot
CodePlex: http://virtualmemorymapview.codeplex.com
GitHub: https://github.com/zodiacon/KernelExplorer
Twitter: https://twitter.com/zodiacon/status/937353202634280960
GitHub: https://github.com/zodiacon/AllTools
Last build: https://github.com/zodiacon/AllTools/blob/master/MemMapView.zip
Скачать: Memory Map Viewer v0.2
VMMap v3.4
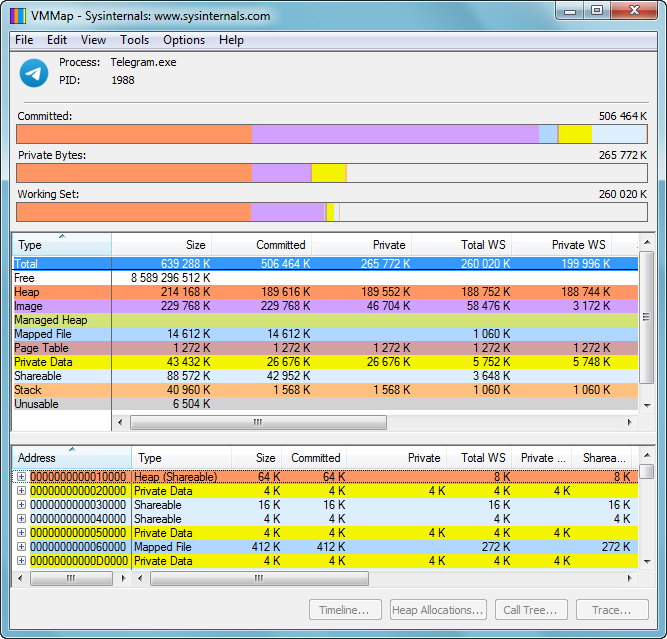
VMMap - is a process virtual and physical memory analysis utility. It shows a breakdown of a process's committed virtual memory types as well as the amount of physical memory (working set) assigned by the operating system to those types. Besides graphical representations of memory usage, VMMap also shows summary information and a detailed process memory map. Powerful filtering and refresh capabilities allow you to identify the sources of process memory usage and the memory cost of application features.
Besides flexible views for analyzing live processes, VMMap supports the export of data in multiple forms, including a native format that preserves all the information so that you can load back in. It also includes command-line options that enable scripting scenarios.
VMMap is the ideal tool for developers wanting to understand and optimize their application's memory resource usage.
Homepage: http://technet.microsoft.com/en-us/sysinternals/dd535533.aspx
Homepage: https://learn.microsoft.com/en-us/sysinternals/downloads/vmmap
Скачать: VMMap v3.4
Process Memory Map v1.5.38 Beta
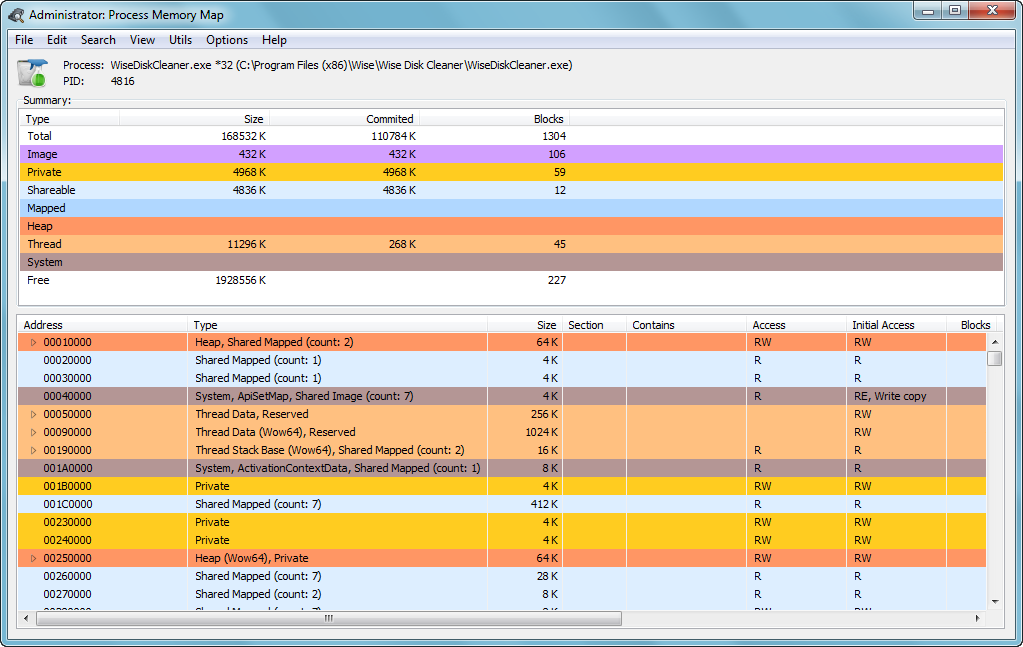
Process Memory Map - утилита предназначенная для отображения карты памяти процесса.
Отображает следующие данные:
• кучи процесса
• данные по нитям, как то: стек, TEB, SEH фреймы и CallStack
• информация по подгруженным PE файлам с разбивкой на секции, точки входа в каждый загруженный образ, их структуры
• данные из PEB
• данные из KUSER_SHARED_DATA
• встроенный x86/x64 дизассемблер (на базе DiStorm)
Предоставляет возможность:
• анализа памяти на предмет установленных перехватчиков в таблицах импорта/экспорта/отложенного импорта
• анализа установленных перехватчиков в экспортируемых функциях, точках входа и TLS калбэках
• анализа блоков памяти на основе их контрольных сумм (например отображение изменений во взломанном ПО).
• поиска в памяти процесса.
Из дополнительных возможностей:
• выводит список экспортируемых функций.
• поддерживает отладочные MAP файлы. (влияет на список распознанных функций и выхлоп дизассемблера)
• отображает изменения в выделенных блоках памяти (alloc/realloc/free)
• быстрая подсказка по известным блокам памяти
Сборка проекта:
Для самостоятельной сборки потребуется:
• установленный пакет компонентов Virtual TreeView версии 8.0 и выше: https://github.com/JAM-Software/Virtual-TreeView
• установленный набор классов для работы с ZIP архивами FWZip версии 1.0.9 и выше: https://github.com/AlexanderBagel/FWZip
Сборка осуществляется с использованием Delphi 10.4.2 Sydney в режиме "Win32/Release", при этом автоматически будет собрана и подключена (в виде ресурса) 64-битная версия данной утилиты. Под более старыми версиями Delphi работоспособность ProcessMemoryMap не проверялась и не гарантируется.
Внутренние версии фреймворков:
• MemoryMap Core - 1.4.36
• RawScanner Core - 1.0.19
• FWZip - 2.0.3
• Distorm - 3.5.3
RoadMap (с предположительными версиями):
• 1.5 полная поддержка DWARF 4 и 5 версий, поддержка типов STUB
• 1.6 вывод размапленой информации по директории resources
• 1.6 вывод используемых ресурсов в виде дерева
• 1.7 вывод размапленой информации по директориям exceptions, security
• 1.7 вывод размапленой информации по директории com+ в виде дерева
• 1.8 вывод размапленой информации по директории debug
• 1.8 поддержка отладочных PDB файлов
• 1.8 перевод вывода системных структур на основе полученных данных из PDB
• 1.9 поддержка отладочной информации JclDebug (возможно в виде плагина)
• 2.0 перевод Hex дампов и дизассемблера на FWHexView
Обновления:
1.5.38 от 13.03.2024
• добавлена настройка поиска номера строки исходного кода относительно адреса возврата в CallStack плюс направление поиска.
• исправлено некорректное определение загруженной отладочной информации по модулю.
• исправлена ошибка при перечислении списка потоков 64 битного процесса с некорректным выходом при подключении первого найденного.
Homepage: https://rouse.drkb.ru / https://rouse.drkb.ru/winapi.php
GitHub: https://github.com/AlexanderBagel/ProcessMemoryMap
Blog Rouse_: https://alexander-bagel.blogspot.com/2013/11/pmm2.html
Habr: https://habr.com/ru/articles/202242/ / https://habr.com/ru/articles/784152/
DelphiMaster: http://delphimaster.net/view/15-1449670082/all
Скачать: Process Memory Map v1.0.0 Alpha 12.1
Скачать: Process Memory Map v1.4.28 Beta
Скачать: Process Memory Map v1.5.38 Beta
CrySearch Memory Scanner v3.3
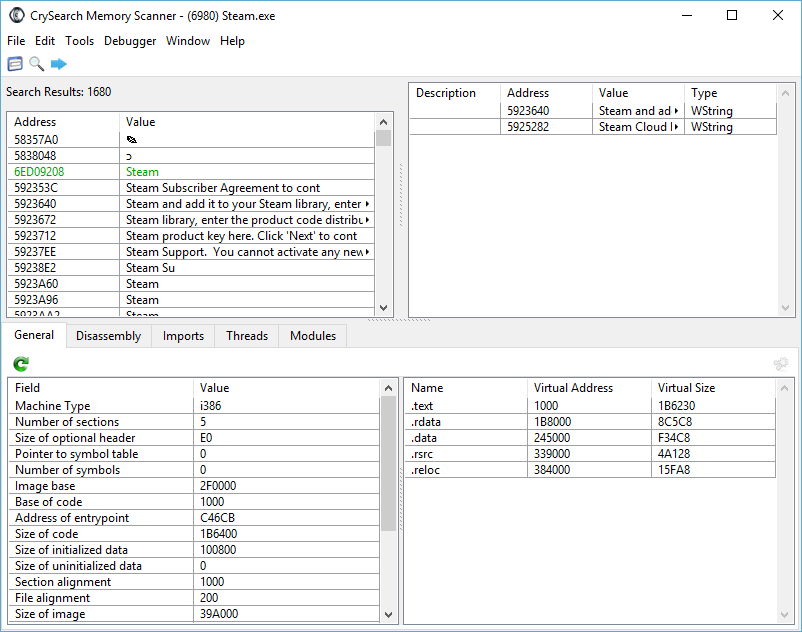
CrySearch - is a lightweight memory scanner application written in C++. Its purpose is analysis, debugging and memory modification. CrySearch is a Cheat Engine-like application, but because my taste and feel is different, my application works in quite a different way, with a few features that are not included in Cheat Engine. I designed the user interface in a way that the toolbar should provide program flow for the user. Cheat Engine's user interface is very populated and the actual disassembling tools are particularly hidden away in the memory viewer. I tend to differ from this approach. I value input from the community, which is why I released CrySearch a few years ago on UnknownCheats.
CrySearch is only available for Windows, both x86 and x64.
Homepage: https://www.crysearch.nl
Source Code: https://bitbucket.org/evolution536/crysearch-memory-scanner [d]
UnKnoWnCheaTs: https://www.unknowncheats.me/forum/general-programming-and-reversing/100677-crysearch-memory-scanner.html
Скачать: CrySearch Memory Scanner v3.3
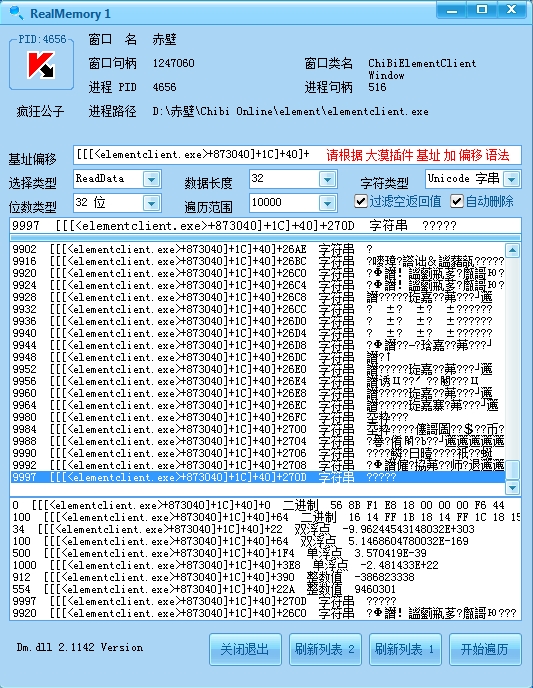
Cheat Engine v7.5 [?] / [?] / [?] | MemoryMonitorDll [?] / [?] | 咪沫内存监视器 v1.0 [?] / [?] | RealMemory 1 [s] | 骷髅头内存遍历工具 v1.0 [?] | 内存遍历 v1.0 [?] | 快速内存遍历工具FMT v1.2 [?] | XH内存遍历工具 v1.0 [?] | ZX内存遍历工具 v1.0 [?]
| 


