


Детальная информация о системном железе (часть 1)
Hardware Sensors Monitor v4.5.4.2 (obsolete)
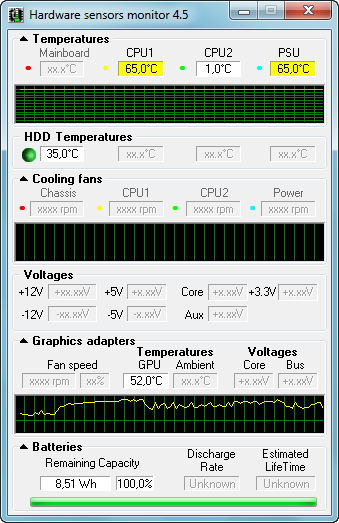
Hardware Sensors Monitor (Hmonitor) - a utility that serves to monitor PC hardware settings. The program is very similar to MotherBoard Monitor, but it has a simple and intuitive interface. Hmonitor informs the user of the processor temperature, motherboard and other devices (with additional sensors), as well as fan speeds and voltages applied to the board.
What's new in version 4.5.4.2:
• Windows 10 support verified;
• Toshiba Satellite R630 notebook support verified;
• Dell XPS 8500 desktop support verified;
• Asus SABERTOOTH Z97 MARK 1 mainboard support verified;
• Asus G75VW notebook support verified;
• 9 Intel series chipsets support added;
• Asus P9X79 mainboard support verified;
• Asus MAXIMUS VII HERO mainboard support verified;
• NS PC87365 / 6 sensor chips support improved;
• full Dell Precision WorkStation 530 MT desktop support added.
Homepage: http://www.hmonitor.com/
Скачать: Hardware Sensors Monitor v4.5.4.2 / Pro (pass: Unpack)
CrystalCPUID v4.15.5.452e (obsolete)
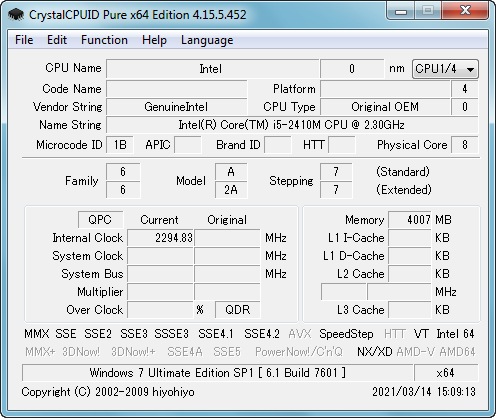
CrystalCPUID - is a CPU utility software.
System Requirements:
OS - x86: Vista/2003/XP/2000/NT4/Me/98/95
OS - x64: Vista/2003/XP
IE - 4.0~
Key Features:
• Support AMD64/EM64T
• Intel SpeedStep Control
• AMD K6/K7/K8/GeodeLX Multiplier/Voltage Control
• VIA CyrixIII/C3 Multiplier Control
• Multiplier Management
• MSR Editor/MSR Walker
• Clock, Cache, System Clock, Multiplier
• Feature Flags
• CPUID
• Process Rule
• Code Name
• Multi Processor
• PCI Device List
• Chipset/VGA information
• BIOS Information
• Change Dialog Font
• Change Wallpaper
FAQ:
Automatic startup with activation of multiplier management.
Set /CQ & /HIDE command line option and put shortcut on Startup. If you would like to get more information, please read ReadMeCpuid.txt.
example
“C:CrystalCPUIDCrystalCPUID.exe”
-> “C:CrystalCPUIDCrystalCPUID.exe” /CQ /HIDE
*This feature may not work on Windows Vista.
Homepage: https://crystalmark.info/en/software/crystalcpuid/
Скачать: CrystalCPUID v4.15.5.452e
C-Temp v1.16a (obsolete)
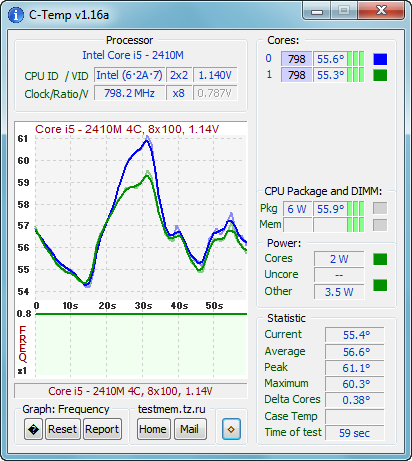
С-Temp - программа мониторинга температуры процессора, ориентированная на получение качественной и количественной информации по его температуре и другим характеристикам.
По большому счету, программа нужна для двух целей - исследования работы системы охлаждения и автоматического разгона процессора. Вторая функция поддерживает связь и управление несколькими приложениями (CST и SefFSB) для автоматического повышения частоты FSB с контролем стабильности процессора. Данная функция потеряла свою целесообразность с уходом процессоров Core2.
В данном случае программа более интересна разделом статистики. В ней отражаются следующие характеристики:
Current - средняя температура по всем ядрам на данный момент (повышенная точность отсчета, по сравнению с простым считывание по конкретному ядру)
Average - средняя температура за всё время. При статическом режиме позволяет измерять температуру очень точно, до десятых долей градуса.
Peak - самая большая температура. Точность и достоверность весьма посредственные.
Maximum - аналогично предыдущей характеристики, но температура усредняется по всем ядрам, выше точность.
Delta Cores - средняя разность температур между ядрами. В 'монолитных' процессорах (из одного кристалла) позволяет отследить неодинаковость теплового контакта кристалл-радиатор. Увы, "криворукая" калибровка процессора может испортить работу датчиков и в монолитном процессоре. Если Core2 Duo показывает крайне маленькую 'дельту', то Sandy Bridge ... ну, Вы это сами хорошо видите по предыдущей картинке. Ой!
Case Temp - температура внутри системного блока, данные берутся из SpeedFan, а он не был запущен, поэтому на картинке в этой позиции пусто. Данный параметр введен как контрольный, при переключении режима измерения на "adjust to" происходит автоматическая компенсация температур к температуре в корпусе. Этот режим полезен в случае тестирования системы охлаждения в закрытом корпусе - температура всех компонентов получается как разность между температурой в системном блоке и нагревом самих компонентов. При нагреве компьютера все температуры начинают смещаться. Для устранения этого дефекта и введена компенсация по температуре корпуса. К слову - режим работает довольно неплохо, но не в каждом корпусе - сказывается место расположения датчика, который сообщает о температуре в системном блоке.
Домашняя страница: https://testmem.tz.ru/ctemp.htm
Overclockers: http://forums.overclockers.ru/viewtopic.php?f=25&t=423918
Скачать: C-Temp v1.16a
OverSoft CPU Informer v0.98 (obsolete)
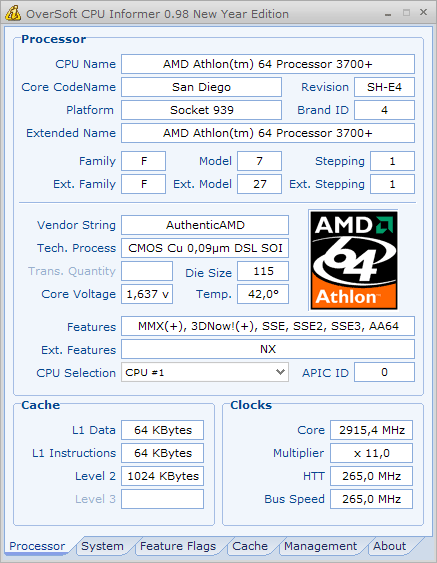
OverSoft CPU Informer (OSCI) - программа разработанная группой энтузиастов форума OverSoft, отображает различную информацию о процессоре и кэше. Основное ее предназначение - предоставление подробной информации об установленном в системе процессоре (позиционируется как аналог CPU-Z, CrystalCPUID, WCPUID), имеет весьма симпатичный интерфейс, обладает функциями мониторинга и механизмами работы с энергосберегающими режимами.
В новую новогоднюю редакцию OverSoft CPU Informer 0.98 внесены такие изменения:
• добавлено распознавание новейших моделей процессоров Athlon 64
• добавлено распознавание двухъядерных процессоров Athlon 64 FX
• добавлено распознавание процессоров Pentium D на ядре Conroe
• добавлено корректное определение наличия технологии виртуализации Vanderpool
• добавлена информация о памяти для большого количества контроллеров памяти
• добавлена поддержка чипов мониторинга Abit uGuru, Fintek F71872, Winbond W83647HF и других
• исправлено распознавание процессоров Pentium D на ядре Smithfield
• исправлены другие ошибки
Домашняя страница: http://oversoft.by.ru/
Сайт: https://overclockers.ru/softnews/show/21000/OverSoft_CPU_Informer_0.98_New_Year_Edition_novogodnyaya_redakciya_nashego_CPUID
Форум: https://forums.overclockers.ru/viewtopic.php?t=83579
Скачать: OverSoft CPU Informer v0.98 New Year Edition / OverSoft CPU Informer v0.98 Fix [?]
RightMark Memory Analyzer v3.80 (obsolete)
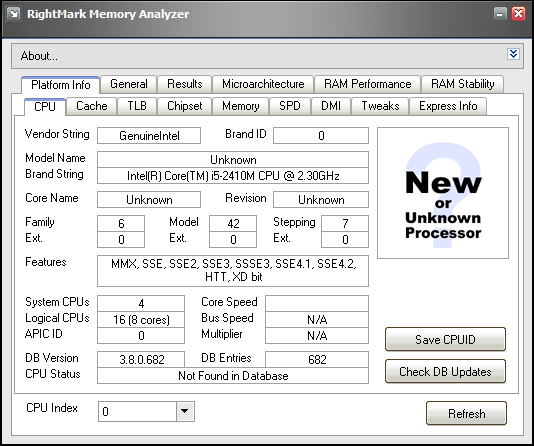
RightMark Memory Analyzer - aims the detailed, stable and accurate measurements of the most important low-level characteristics of the CPU/Chipset/RAM subsystem of your PC.
Seven types of tests are implemented in the current release of the RightMark Memory Analyzer suite, that allow you to determine the following low-level parameters of the platform:
• Average and peak memory bandwidth;
• Average and minimal L1/L2 data cache/memory latency;
• L1/L2 data cache associativity;
• L1-L2 data cache bus bandwidth;
• D-TLB size and associativity (of each level);
• L1 instructions cache size (including the "effective" size) and associativity;
• Decode efficiency of various simple x86 (ALU/FPU/MMX) instructions;
• I-TLB size and associativity (of each level).
What's New in version 3.8:
- RightMark Memory Stability Test (RMMS) component updated to version 1.2: Improved memory allocation scheme allowing testing up to 2000MB of memory at once, if available; added log file time stamp.
- RightMark Multi-Threaded Memory Test (RMMT) component updated to version 1.1: Added individual threads selection to the "All Threads" group, improved "Lock Virtual Memory Pages" feature behavior.
- Added EPP/XMP info to the RMMA System Info report.
- Added support for DDR3 SPD and Intel XMP (eXtreme Memory Profiles) SPD extension.
- Added limited support for Intel 3 series chipsets (Memory SPD reading).
- Added identification of several AMD Athlon 64 X2 NPT (revision F) CPU cores.
- Added identification of new Intel Core 2 CPUs, including 45nm cores.
- New CPU Database entries.
Homepage: https://cpu.rightmark.org/products/rmma.shtml / https://cpu.rightmark.org/products/rmma_rus.shtml
Скачать: RightMark Memory Analyzer v3.80
HWM BlackBox v2.3 (obsolete)
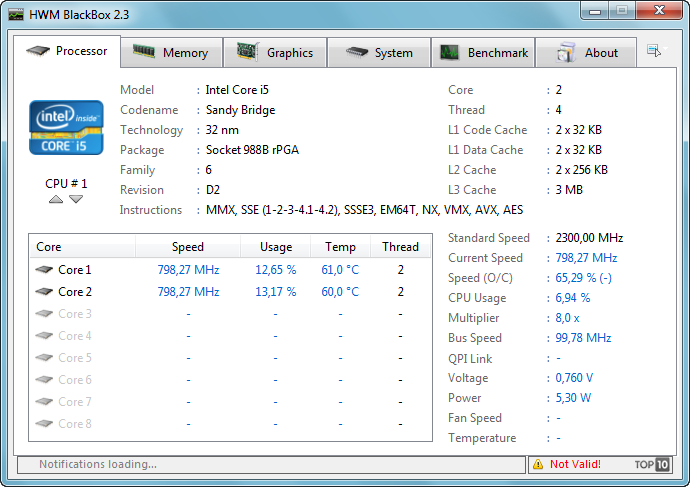
HWM BlackBox - is a utility designed to deliver precise details on the core components of your computer to the maximum. As well as providing you with you with in-depth information about hardware such as the processor, memory modules, mainboard, hard drives and video card, it also offers the opportunity to assess critical parameters such as clock speeds and temperatures. HWM BlackBox also presents Vista – compatible tools to test your computer's performance under Microsoft Windows Vista.
Homepage: http://blackbox.hardwaremania.com/en / http://hwmblackbox.com/en/
Скачать: HWM BlackBox v2.3 / II
BatteryCare v0.9.36.1
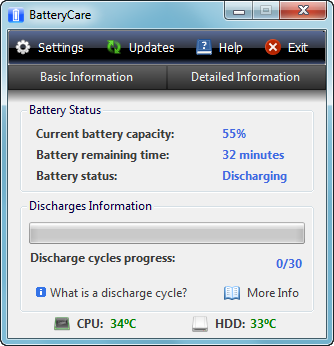
BatteryCare - is a software created to optimize the usage and performance of the modern laptop's battery
It monitors the battery's discharge cycles and helps increasing it's autonomy and improving its lifetime
Features:
• Battery's discharge cycles monitoring
• Complete battery information
• CPU and HDD temperature reading
• Automatic power plans switching
• Control over Windows Aero and demanding Services
• Notification area information
• Auto-updates
• Lightweight in the system
Available in English, Portuguese, German, Spanish, French, Italian, Russian, Danish, Czech, Polish, Dutch, Turkish and Latvian
Compatible with Microsoft Windows XP, Vista, 7, 8 and 10
Homepage: https://batterycare.net/en/index.html
Скачать: BatteryCare v0.9.36.1 / II
SSD-Z v16.09.09 (Beta)
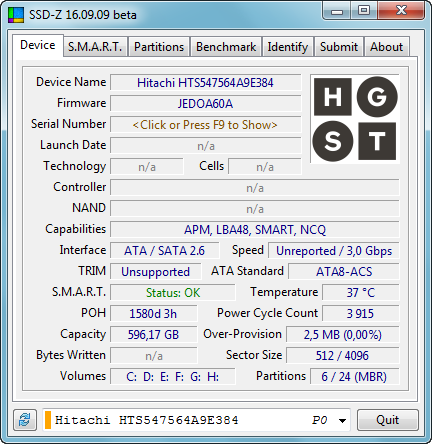
SSD-Z - is an information tool for Solid State Drives and other disk devices.
Using a database, it will show information about your SSD, such as the controller, processing tech, NAND type etc.
Other useful information related to disk devices are also shown, such as S.M.A.R.T. status and partition layout.
Features:
- Details of the controller and processing tech of NAND chips (for known devices).
- Verify that TRIM is enabled for your system and SSDs.
- S.M.A.R.T. status and full list of all the device's available attributes.
- List of all partitions. Including hidden, unmapped and boot partitions.
- Benchmark IOPS, transfer speed and random access time (work in progress)
- View the raw device identify data words.
Homepage: http://www.aezay.dk/aezay/ssdz/
Скачать: SSD-Z v16.09.09 Beta
3DP Chip v21.01
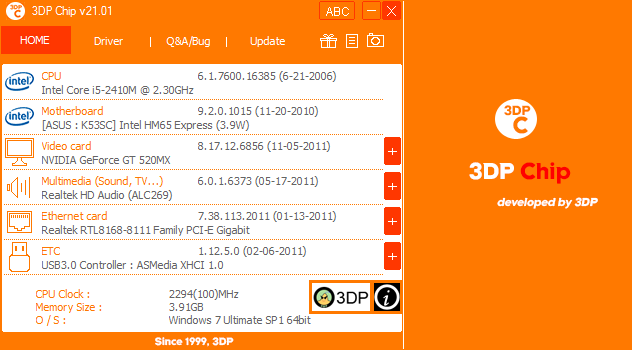
3DP Chip - will enables you to enumerate devices and download the latest device drivers with few simple clicks. Problems with detecting your devices, finding device drivers to setup your system is worse than Blue screen of death. Everest and Aida32 doesn't provies you a device drivers and they are still heavy.
You can use it just for enumerate the devices such as CPU, MOBO, Graphic Card, Sound Card and Ethernet Card. And you can download the latest device drivers through our web site.
Homepage: https://www.3dpchip.com/3dpchip/sub/chip_eng.html
Скачать: 3DP Chip v21.01 / 3DP Chip v21.03.1
Core Temp v1.16
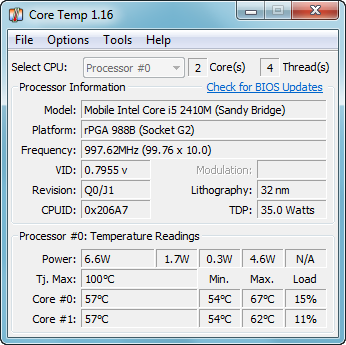
Core Temp - is a compact, no fuss, small footprint, yet powerful program to monitor processor temperature and other vital information.
What makes Core Temp unique is the way it works. It is capable of displaying a temperature of each individual core of every processor in your system!
You can see temperature fluctuations in real time with varying workloads. Core Temp is also motherboard agnostic.
Core Temp Requirements
Operating System: Microsoft Windows XP, Vista, 7, 8, 10, 2003 Server, 2008 Server, 2012 Server, 2016 Server.
Processor: Intel, AMD or VIA x86 based processor.
Version 1.16 - 29th June, 2020
- New: Intel 10th generation CPU support (Cannon/Ice/Comet Lake)
- New: Package Power reading for AMD Zen based CPUs
- New: Very preliminary Intel Tigerlake support
- New: Preliminary AMD Renoir support
- New: AMD Picasso detection
- New: Intel Lakefield detection
- Fix: System hangs during ATI SMBus dump in AIDA64
- Fix: Crash when display DPI changes
- Fix: Crash when opening Settings dialog
- Fix: Main window incorrectly resized when display DPI changes
- Fix: High CPU usage on unsupported Intel CPUs
- Change: Expand available information on unsupported Intel CPUs
- Change: Improve stepping detection on supported Intel CPUs
- Change: Frequency detection changes for Nahelem/Westmere to make it consistent with newer Intel CPUs
Homepage: https://www.alcpu.com/CoreTemp/
Скачать: Core Temp v1.16
CPU-Z v1.95
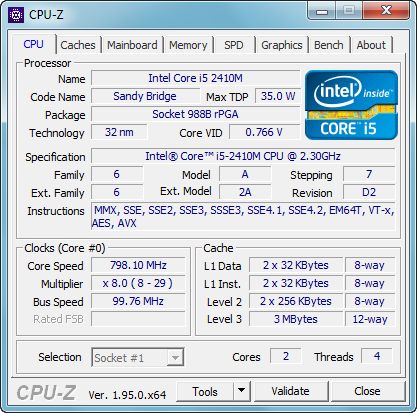
CPU-Z - is a freeware that gathers information on some of the main devices of your system:
- Processor name and number, codename, process, package, cache levels.
- Mainboard and chipset.
- Memory type, size, timings, and module specifications (SPD).
- Real time measurement of each core's internal frequency, memory frequency.
VERSION 1.95 FOR WINDOWS®
• Intel Core 11th generation "Rocket Lake".
• AMD ThreadRipper PRO 3995WX, 3975WX, 3955WX, 3945WX and WRX80 chipset.
• AMD Cezanne and Lucienne APUs.
• Mainboard PCI-Express generation report (Mainboard tab).
• Graphics Interface Link current speed and max speed (Mainboard tab).
• NVIDIA GPU base and boost clocks (Graphics tab).
Homepage: https://www.cpuid.com/softwares/cpu-z.html
Скачать: CPU-Z v1.95
NVIDIA Inspector v1.9.8.1
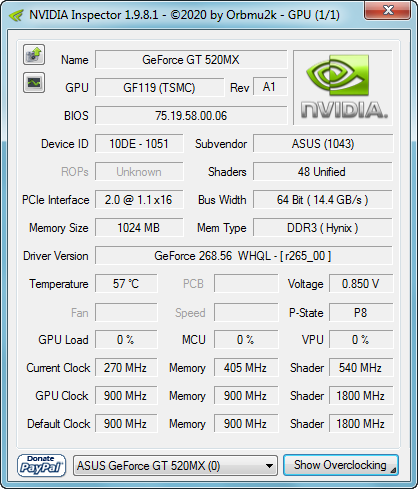
NVIDIA Inspector v1.9.8.1, now also known as nvidiaProfileInspector download - NVIDIA Inspector is a handy application that reads out driver and hardware information for GeForce graphics cards.
The tool is basically an nVIDIA only OverClocking application, you can set your clocks and fan speeds. Orbmu2k has released this program, which seems to NVIDIA graphics cards and offers information on tools for GPU and memory clock speed, GPU operating voltage and fan speed increase. This is a quite simple user interface with an application that will rely entirely NVIDIA drivers, so there is reason to be downloaded from NVIDIA's website WHQL-certified driver.
NVIDIA Inspector - Version 1.9.8.1 (.NET Framework 2 or above)
• added "dpiAware" flag to support win8+ dpi scaling
• avoid interupting status requests on optimus cards
• show power usage in watts on main page if supported and nvml is available
• added encoder usage to monitoring if supported and nvml is available
• added decoder usage to monitoring if supported and nvml is available
• added power limit status to monitoring
• added thermal limit status to monitoring
• added reliability voltage limit status to monitoring
• added sli sync boost limit to monitoring
• added CLI param "setVoltagePoints"
• added CLI param "dumpVoltagePoints"
• changed CLI param "lockVoltagePoint" to also use uV instead of mV
• fixed calling CLI made voltage points reset
• added max boost clock estimation for pascal with voltage point support
NVIDIA Inspector: https://www.guru3d.com/files-details/nvidia-inspector-download.html
NVIDIA Profile Inspector: https://github.com/Orbmu2k/nvidiaProfileInspector
Скачать: NVIDIA Inspector v1.9.7.8 / NVIDIA Inspector v1.9.8.1
Скачать: NVIDIA Profile Inspector v2.3.0.13
TechPowerUp GPU-Z v2.38.0
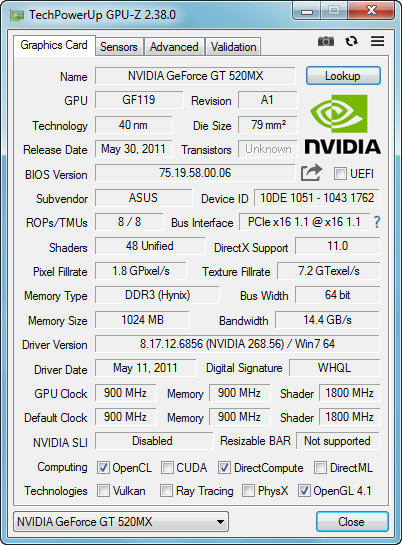
GPU-Z - is a lightweight system utility designed to provide vital information about your video card and graphics processor.
Main Features:
• Supports NVIDIA, AMD, ATI and Intel graphics devices
• Displays adapter, GPU and display information
• Displays overclock, default clocks and 3D clocks (if available)
• Includes a GPU load test to verify PCI-Express lane configuration
• Validation of results
• GPU-Z can create a backup of your graphics card BIOS
• No installation required, optional installer is available
• Support for Windows XP / Vista / Windows 7 / Windows 8 / Windows 10 (both 32 and 64 bit versions are supported)
• .. and yes, the author of CPU-Z has granted us permission to use a name similar to his product. Thanks Franck.
Enterprise Licensing:
GPU-Z is free to use for personal and commercial usage. However, you may not redistribute GPU-Z as part of a commercial package.
We also offer a GPU-Z SDK, which is provided as simple-to-use DLL with full feature set. Commercial support and customization options are available, please contact us for details.
Homepage: https://www.techpowerup.com/gpuz/
Скачать: TechPowerUp GPU-Z v2.24 / TechPowerUp GPU-Z v2.38.0
GPU Caps Viewer v1.50.1.0

GPU Caps Viewer - is an OpenGL and OpenCL graphics card utility for Windows XP and Vista (32/64-bit). This tool offers the following features:
• quick view of the graphics configuration (graphics card / GPU type, amount of video memory, drivers version)
• display of the main OpenGL capabilities (OpenGL version, texture size, number of texture units, etc.)
• display of OpenCL API support and extensions.
• display of the OpenGL extensions supported by your graphics card or display of all existing OpenGL extensions no matter what graphics card you have. For each extension, you can open its description webpage available at the OpenGL Extension Registry or at NVIDIA's OpenGL Extensions spec. Very handy for graphics developers!
• display of NVIDIA CUDA level support
• display of the system configuration: CPU type and speed, amount of systeme memory, operating system, PhysX version
• display of the GPU core temperature
• GPU Burner or Stability Test: allows to overheat the GPU in order to test the graphics card stability. You can start several stress test demos in the same time in order to make your graphics card working to the maximum.
• list of links related to your graphics card: graphics drivers and graphics cards reviews. These links are regularly updated.
• full report in text and XML format. This kind of report is useful for developers who needs an outline of the customer graphics system (for support purposes for example).
• graphics card validation: your graphics card data is sent to oZone3D.Net server and in return you receive a link on the validation web page. You can use that validation in benchmarks or to help graphics applications developers to solve specific problems. See this page for further explanation.
Homepage: https://ozone3d.net/gpu_caps_viewer
Download: https://www.geeks3d.com/20210125/gpu-caps-viewer-1-50-0-released/
Скачать: GPU Caps Viewer v1.50.1.0
GFXplorer v3.13.0.1350
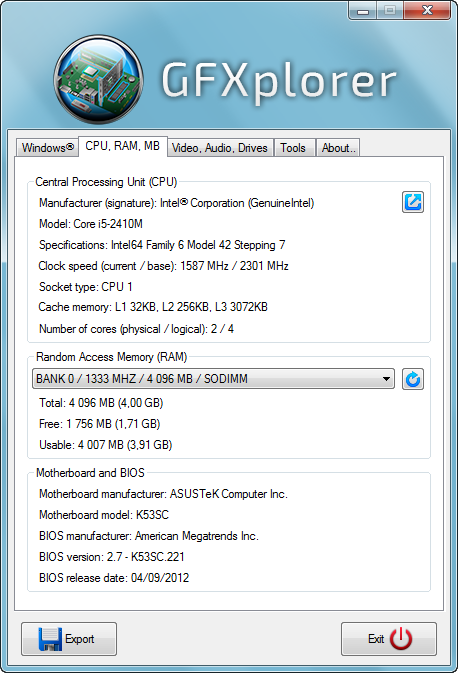
GFXplorer - is a tool designed to allow its user to find, or just to have at hand, all the most important technical information, both hardware and software, of a PC.
Thanks to the tabs based user interface and the various categories available, all the information are easy and fast to read, and if reading is not enough: you can export all the information in a common plain text file (TXT) or Rich Text file (RTF) to be viewed anywhere and by anyone without being in front of the interested PC; whenever the need arises, receiving technical support or help on a forum or via email is a lot easier with detailed information of your system!
In addition, the Tools tab provides direct access to a wide range of Windows utilities, useful should you need to do a quick maintenance.
GFXplorer can also be easily updated online and is available both in English and Italian.
New in version 3.13:
• Added support for Windows 10 - 20H2;
• Added OS public release date;
• Added OS end of support date;
• Added support for Unicode and ANSI simple text report exporting;
• Addes support for legacy, light and dark themes;
• GFXplorer's window is now vertically resizable;
• Tweaks and code optimizations.
Homepage: https://www.xtreme-lab.net/en/gfxplorer.htm
Скачать: GFXplorer v3.13.0.1350
CPU Thermometer v1.3
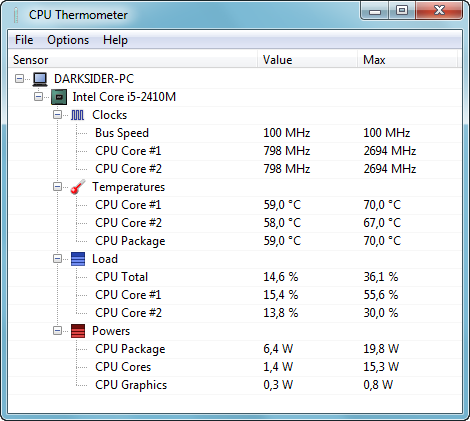
CPU Thermometer - is one free CPU temperature monitor; it can help you monitor your computer CPU temperature in live time. Program can start with Windows start-up, and show live CPU temperature in your desktop tray icon, so you get this important system information at a glance. This is one completetly freeware, easy to install and easy to use.
• Support most Intel and AMD processors;
- Intel: Pentium, Dual-Core, Core 2 Duo, Xeon, Core i3, Core i5, Core i7 and more;
- AMD: Athlon, Athlon XP, Phenom, Quad-core, Turion and more;
• Need Microsoft .NET Framework installed;
• Support Windows Vista/2008/7/10 (include 32bits and 64bits);
If your PC is very old, program need .NET Framework installed from Microsoft, need .NET Framework runtime and associated files, this is one very small but useful software.
The old version does not work in Windows 7/10, so I had to rewrite the software. The new version of CPU Thermometer is based "Open Hardware Monitor Project" by Michael Moller.
Homepage: http://www.cputhermometer.com
Скачать: CPU Thermometer v1.2 / CPU Thermometer v1.3
Open Hardware Monitor v0.9.6
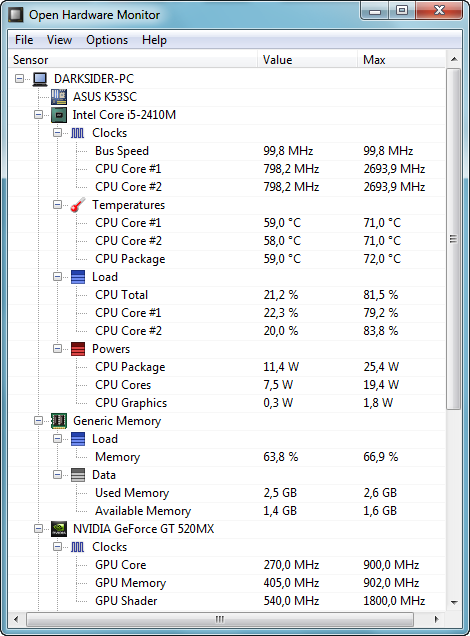
The Open Hardware Monitor - is a free open source software that monitors temperature sensors, fan speeds, voltages, load and clock speeds of a computer.
The Open Hardware Monitor supports most hardware monitoring chips found on todays mainboards. The CPU temperature can be monitored by reading the core temperature sensors of Intel and AMD processors. The sensors of ATI and Nvidia video cards as well as SMART hard drive temperature can be displayed. The monitored values can be displayed in the main window, in a customizable desktop gadget, or in the system tray. The free Open Hardware Monitor software runs on 32-bit and 64-bit Microsoft Windows XP / Vista / 7 / 8 / 8.1 / 10 and any x86 based Linux operating systems without installation.
Version 0.9.6
- Added AMD family 19h (Zen 3) CPU support.
Remote Web Server [?]
Homepage: https://openhardwaremonitor.org
Source Code: https://github.com/openhardwaremonitor/openhardwaremonitor
Скачать: Open Hardware Monitor v0.9.6
Libre Hardware Monitor v0.8.7
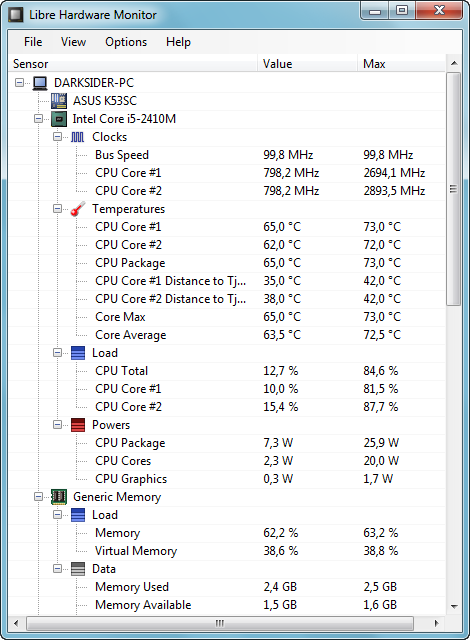
Libre Hardware Monitor, a fork of Open Hardware Monitor, is free software that can monitor the temperature sensors, fan speeds, voltages, load and clock speeds of your computer.
With the help of LibreHardwareMonitor you can read information from devices such as:
• Motherboards
• Intel and AMD processors
• NVIDIA and AMD graphics cards
• HDD, SSD and NVMe hard drives
• Network cards
Source: https://github.com/LibreHardwareMonitor/LibreHardwareMonitor
Скачать: Libre Hardware Monitor v0.8.7
HWMonitor PRO v1.44
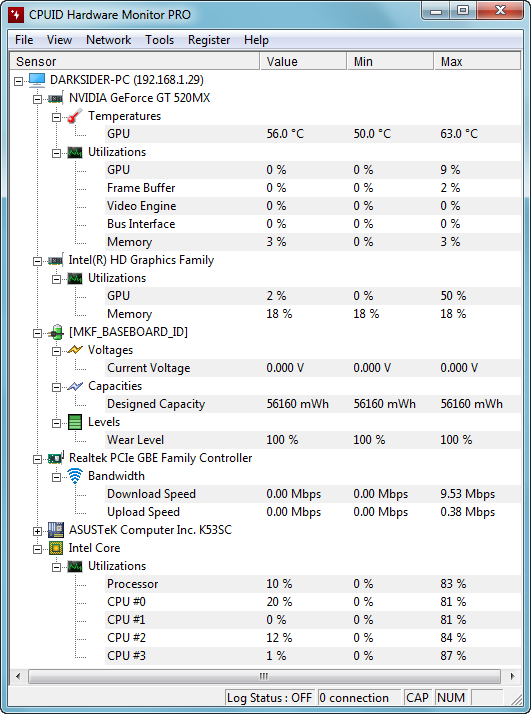
HWMonitor PRO - is the extended version of HWMonitor. In comparison to its classic counterpart, HWMonitor PRO adds the following features:
Remote Monitoring:
- Watch the sensors of one or several distant PCs or Android devices using a simple TCP/IP connection.
Graph Generator:
- Save monitoring data and generate logging graphs as bitmap files.
Improved Interface:
- Sensors in system tray, editable sensors labels…
VERSION 1.44 FOR WINDOWS®
• Fix IP selection when multiple IP are available.
• Fix saving minimized and tray modes.
• Fix tray icons bugs.
• Add auto start.
• Intel Core 11th generation "Rocket Lake" and Z590 chipset..
• AMD Ryzen 5000 "Zen 3" Vermeer.
• AMD ThreadRipper PRO 3995WX, 3975WX, 3955WX, 3945WX and WRX80 chipset.
• AMD Cezanne and Lucienne APUs.
• AMD Radeon 6000 GPUs.
• NVIDIA RTX 3000 GPUs
Homepage: https://www.cpuid.com/softwares/hwmonitor-pro.html
Скачать: HWMonitor PRO v1.44
HWiNFO v7.00
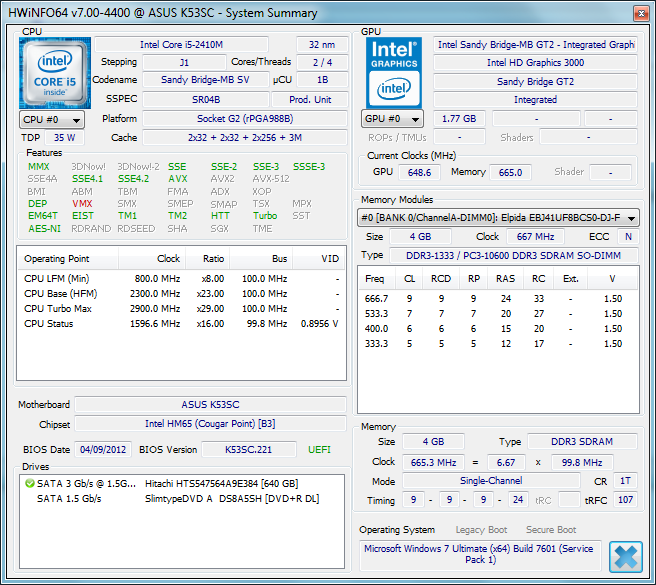
HWiNFO - is an all-in-one solution for hardware analysis and monitoring supporting a broad range of OSes (DOS, Microsoft Windows 95 - Windows 10) and platforms (i386 - Xeon Platinum).
Latest v7.00
- HWiNFO64 is limited to non-commercial use only. Check License terms.
- Introducing HWiNFO64 Pro for commercial use and additional features.
- Enhanced sensor monitoring on MSI H510 series mainboards.
- Fixed monitoring of +12V on some ASUS Z590 series mainboards.
- Improved support of LPDDR3/LPDDR4/LPDDR4X memories.
- Fixed a possible WHEA error/system crash during long-term monitoring of AMD RX 6000 series GPUs.
- Enhanced sensor monitoring on ASRock Z590 Taichi and Z590 PG Velocita.
- Consolidated AMD Navi monitoring, added Effective Clock and TGP Power for Navi21.
- Added sensor tool tips to provide more details about sensors and their values.
- Improved sensor UI responsiveness during some operations.
- Improved handling of disappearing/reappearing sensors in custom order.
- Fixed a possible hang when logging sensors with large sets of disabled items.
- Added monitoring of GPU HotSpot temperature for NVIDIA GPUs.
- Improved reporting of GPU memory vendor and ROP count for AMD GPUs.
- Enhanced sensor monitoring on ASRock J4105-ITX.
- Fixed reporting of effective clock on AMD Ryzen 1st generation CPUs.
- Added preliminary support for DDR5 thermal sensors.
Homepage: https://www.hwinfo.com/about-software/
Скачать: HWiNFO v7.00
Free PC Audit v5.0.1210.53

Free PC Audit - is a freeware system, hardware and software information tool. It extracts details of all components of the PC, shows installed software with version and product key. Free PC Audit does not require installation and can be used as a portable application. It can be run from a removable storage device such as a CD-ROM drive, USB flash drive, flash card, or floppy disk.
This professional tool is designed to collect and present the maximum amount of information possible about computer's hardware and software which makes them suitable for users searching for driver updates, computer manufacturers, system integrators and technical experts as well.
Homepage: https://www.misutilities.com/free-pc-audit/index.html
Скачать: Free PC Audit v5.0.1210.53
Memory Viewer v1.03
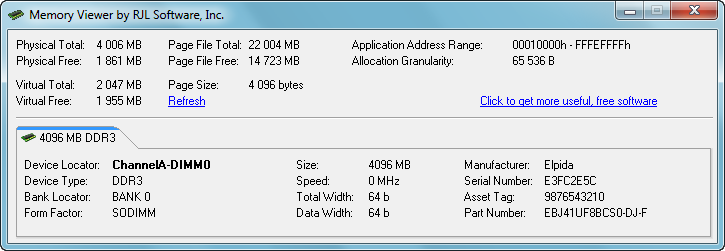
With Memory Viewer you can view your system memory configuration, without having to open the box! Not only does Memory Viewer show you the channel, dimm, size and speed.... but it also shows you the type of memory: SDRAM, DDR, etc. Memory Viewer can save you time by telling you detailed information about the memory cards installed in your computer, as well as the current memory allocation. Check out the screenshots to see what we are talking about.
With Memory Viewer you can get information such as the physical location on the motherboard, channel, dimm number, device type, bank locator, synchronous type, dimm factor, chip size, memory speed, total width, manufacturer, serial number, asset tag, part number and more. Memory Viewer retrieves the most information from your Windows system memory
Homepage: http://www.rjlsoftware.com/software/utility/viewmem/
Скачать: Memory Viewer v1.03
(SIV) System Information Viewer v5.56
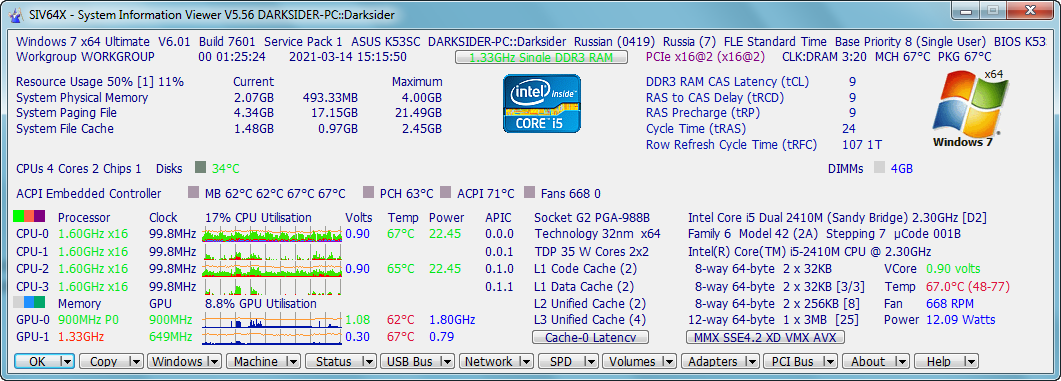
System Information Viewer - is a general Windows utility for displaying lots of useful Windows, Network and hardware info - CPU info, PCI info, PCMCIA info, USB info SMBus info, SPD info, ACPI methods, Machine info, Hardware Sensors, Networked computers, Operating System Information and more. SIV is designed for Windows 10, 8.1, 8.0, 7, Vista, XP, 2019, 2016, 2012, 2008, 2003, 2000, NT 4.00 and NT 3.51. Windows 95, 98 and Me are also supported.
Homepage: http://rh-software.com
Скачать: System Information Viewer v5.56
SystemInfo v1.4.3
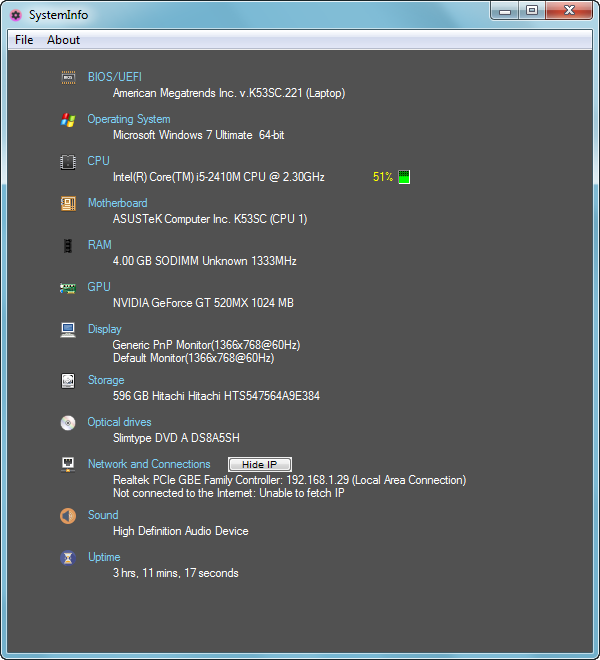
SystemInfo - a hardware information tool for Windows
SystemInfo enables you to view information about the hardware components of your computer.
The program allows you to take screenshots of the client area and export hardware information in the following formats:
- HTML (with CSS)
- XML
- Simple text
Supports the following operating systems:
- Windows Vista (x86/x64)
- Windows 7 (x86/x64)
- Windows 8/8.1 (x86/x64)
- Windows 10 (x86/x64)
Might also work on modern Windows Server systems, but I didn't test it.
The program is written in C/C++ and uses barebones WindowsAPI for its GUI.
This program is free software.
Source: https://github.com/CherryPill/system_info
Скачать: SystemInfo v1.4.3
SimpleSysInfo v3.0
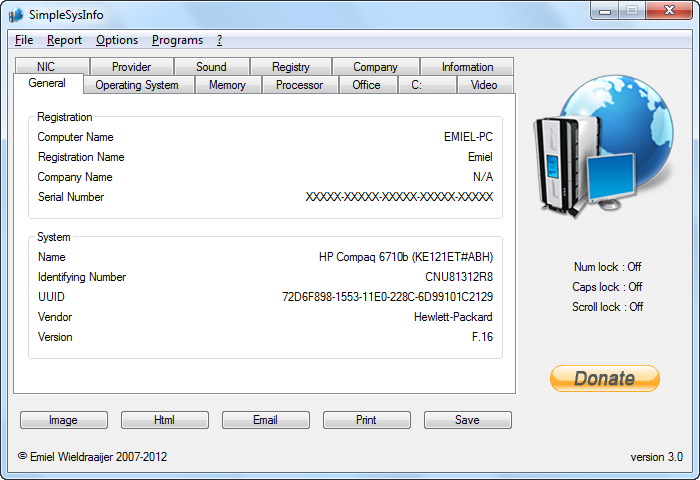
Simple retrieve information from your computer. Retrieved information can be send everywhere by selecting the email button. It's possible to print the information and save it to a text file. SimpleSysInfo also supports creating a HTML file which is less hard to read.
SimpleSysInfo 3.0
- July 30th 2012
Homepage: http://www.wieldraaijer.nl/others.html
Скачать: SimpleSysInfo v3.0
DriveInfo v5.4.614
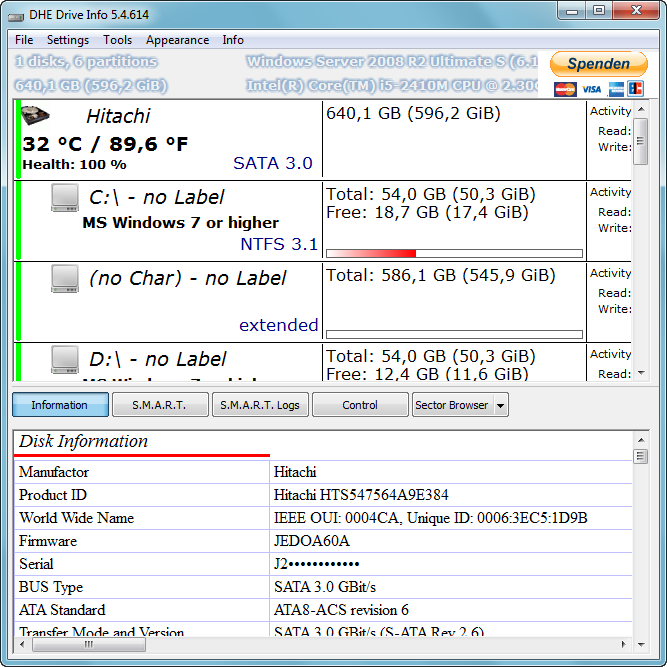
DriveInfo (HDD, SSD Information Tool)
Current Version: 5.4.614 (Mar 13. 2019)
Windows 2000, Win XP, Vista, 7, 8, 8.1, 10, 11, x32 and x64 (WOW)
Features:
• HDD Data
▫ Manufacturer
▫ Product ID
▫ Serialnumber
▫ Firmware
▫ ATA-Standard
▫ BUS Info (S-ATA 150/300/600, P-ATA, USB, SCSI)
▫ Size (28bit und 48bit)
▫ Buffer Size
▫ Rotation Rate
▫ Formfactor
▫ Transfer (SATA I/II/III, ATA 16-133, PIO)
▫ Security Features
▫ Features (NCQ, TCQ, TRIM, HPA, DCO, Freefall Control, Download Microcode)
▫ AAM
▫ APM
▫ Master Boot Record
▫ Disk ID
▫ Bootloader
• S.M.A.R.T.
▫ Temperature (current, Min, Max)
▫ Value, Threshold, Worst, RAW, Type
▫ Capabilities
▫ Self-Tests
▫ S.M.A.R.T. Logs
▪ List of all available Logs inclusive GPL (for P-ATA,S-ATA, USB)
▪ Self-Test Log
▪ Selective Self-Test Log
▪ Extended Self-Test Log
▪ Error Log
▪ Comprehensive Error Log
▪ Extended Comprehensive Error Log
▪ SCT Status Log (Temperature Log)
▪ SCT Temperature History (not for USB-HDDs)
▪ SATA Phy Event Counter Log
▪ NCQ Command Error Log
▪ Write Stream Error Log
▪ Read Stream Error Log
• Controller
▫ Name
▫ Vendor ID, Name
▫ Device ID, Name
▫ Port
▫ Driver Version
• Adapter
▫ Name
• Partitions
▫ Partition scheme (MBR/GPT/Superfloppy)
▫ Volume Boot Record
▫ Filesystem
▫ Serialnumber
▫ installed OS
▫ Info for Bootpartition
▫ Size, free Size
▫ Partitionlabel
▫ Partitionname
▫ Infos about MFT and FAT
• for P-ATA, S-ATA, some IDE-To-USB-Adapter
• USB-Sticks, FlashDrives
• experimental SCSI support
Workarounds for:
• ADATA SSD Firmware 3.4.6 Temperature bug
• OCZ VERTEX3 Firmware 2.02 S.M.A.R.T. Threshold bug
• Plextor PX-xxxM2PP Firmware 1.05 Power on Hours bug
Version 5.4 (Mar 13. 2019; current version)
- ACS-5 support
- SATA Rev. 3.2 support
- IDENTIFY DEVICE data log support
- Windows 10 Redstone 2, 3, 4, 5 support
- Windows 10 Anniversary Update support
- reports current speed and max supported speed
- S.M.A.R.T.: improved support Samsung, OCZ, Crucial, Kingston and Intel
- Bugfix Button APM and AAM
Homepage: http://dirkhauschild.de/di.php
Homepage: http://dirkhauschild.de/di_eng.php
Скачать: DriveInfo v5.4.614
CrystalDiskInfo v8.11.2
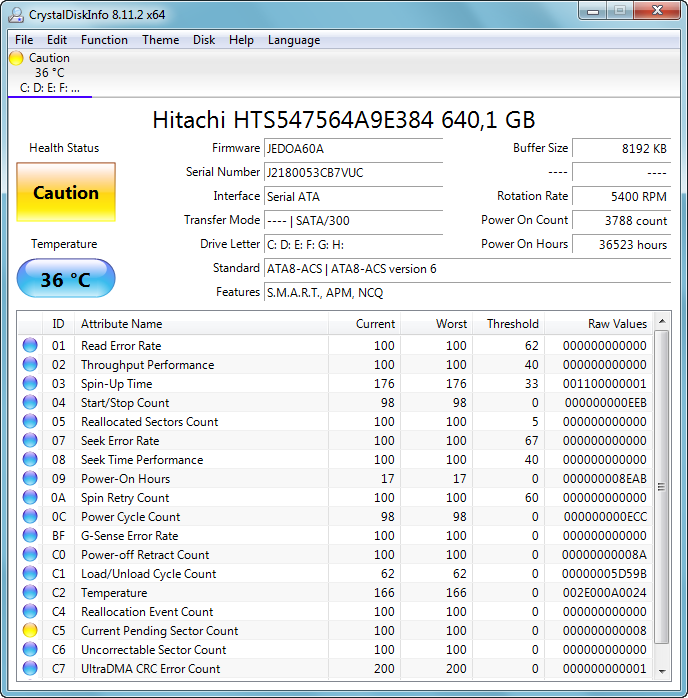
CrystalDiskInfo - A HDD/SSD utility software which supports a part of USB, Intel/AMD RAID and NVMe.
System Requirements:
OS - Windows XP/Vista/7/8/8.1/10
OS - Windows Server 2003/2008/2012/2016/2019
Architecture - x86/x64/ARM64
IE - 8.0~
.NET - 2.0~
• Installer does not support Windows XP/2003(NT5.x).
• Not support Windows 95/98/Me/NT4/2000.
• Not support Server Core.
Version 8.11.2 [2021/02/23]
- Improved language auto detection
- Update language files (Simplified Chinese)
Homepage: https://crystalmark.info/en/software/crystaldiskinfo/
Download: https://crystalmark.info/en/download/
Скачать: CrystalDiskInfo v8.11.2
Indicium v2.0
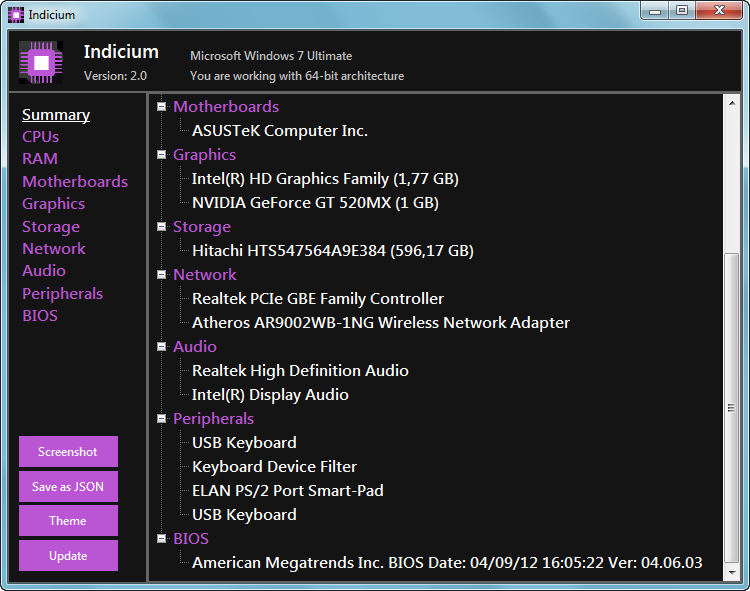
Summary:
Portable, advanced system information utility.
It's also capable of recovering Windows product key.
Features:
• Operating system details
• Windows product key
• CPUs
• RAM modules
• Virtual memory
• Motherboards
• Graphics cards
• Storage (disks, volumes, opticals, removables)
• Network Adapters (physicals, virtuals)
• Audio devices
• Peripherals (keyboards, pointing devices)
• BIOS information
• Capture screenshots
• Save information in JSON
Compatibility:
.NET Framework 4.5.2
Compatible with Windows 7, 8, 8.1, 10
Does not work with Windows XP or Vista
Source: https://github.com/hellzerg/indicium
Скачать: Indicium v2.0
GPU Shark v0.22.1.0
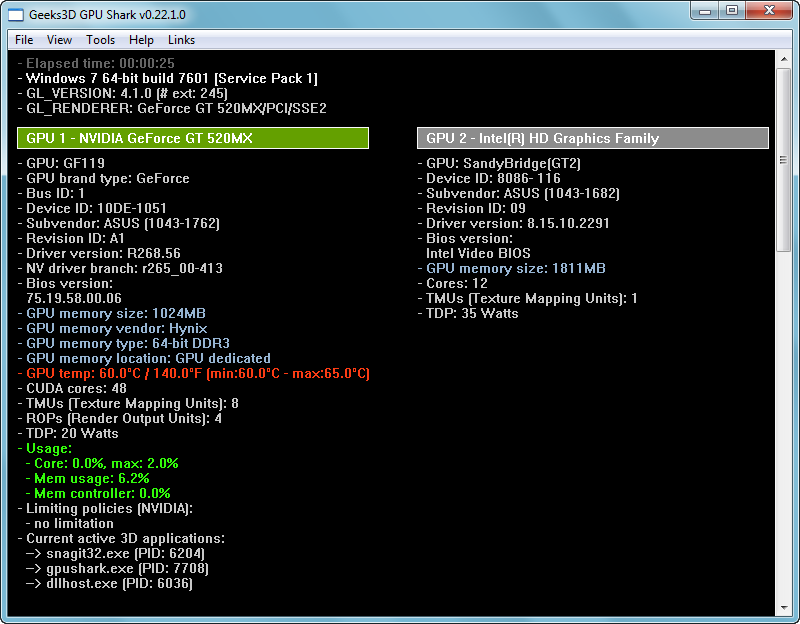
GPU Shark - is a simple, lightweight (few hundred of KB) and free GPU monitoring tool, based on ZoomGPU, for NVIDIA GeForce and AMD/ATI Radeon graphics cards. GPU Shark is available for Microsoft Windows only (XP, Vista and Seven). GPU Shark offers a global view of all your graphics cards in a single window. More information HERE.
GPU Shark can display for every GPU the clock speeds (GPU core, memory), fillrates, performance states (or PStates), GPU fan speed, GPU/memory/MCU usage and power consumption (NVIDIA).
Version 0.22.1.0 - 2021.03.09
+ added support of NVIDIA GeForce RTX 3060 and CMP 30HX/40HX.
+ added support of AMD Radeon RX 6700 XT.
! updated: ZoomGPU 1.29.1 (GPU monitoring library)
Homepage: https://ozone3d.net/gpushark/
Download: https://www.geeks3d.com/20210125/gpu-shark-0-22-0-released/
Скачать: GPU Shark v0.22.1.0
System Information Retriever v1.0.4 (SIR)
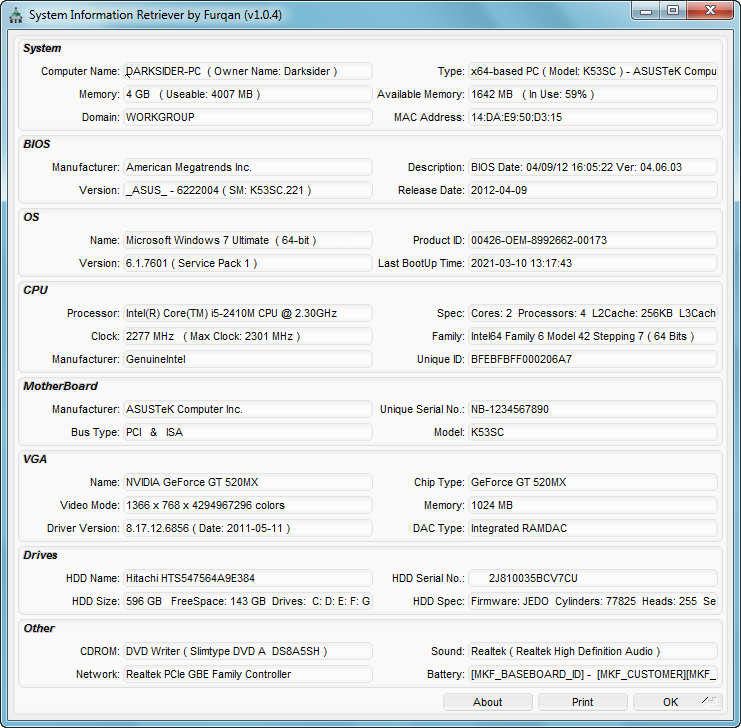
SIR - is portable application for Windows that displays information of the system’s hardware and OS. It is a must have tool for every computer user, it does not require installation, you can run it directly from a USB flash drive, without worrying that it might affect your registry. It displays all the important information of the system on one page, which can be printed out by pressing the print button.
It features a simple interface that displays:
- General system information such as computer name, system type, notebook model and manufacturer, memory, MAC Address, domain
- Bios manufacturer, version, release date
- Operating system details
- CPU type, clock, cache, family, manufacturer, ID number
- Motherboard model, manufacturer, bus type, serial number
- Video cards internal and external, video mode, driver version, chip type, memory
- Hard drive name, size, and serial number, usb drive and serial number
- Additional information: CD/DVD Rom, Sound card, Network Card, Printer, and Notebook battery
It’s a handy tool to carry on a USB stick to quickly view system information on any computer.
~ Latest version 1.0.4 released on 2013.12.30. (fixed compatibility issues with Windows 8.1)
Homepage: http://www.real3d.pk/sir.html / https://real3dtech.com/system-information-retriever.html
Скачать: SIR System Information Retriever v1.0.4
HiBit System Information v2.0.25
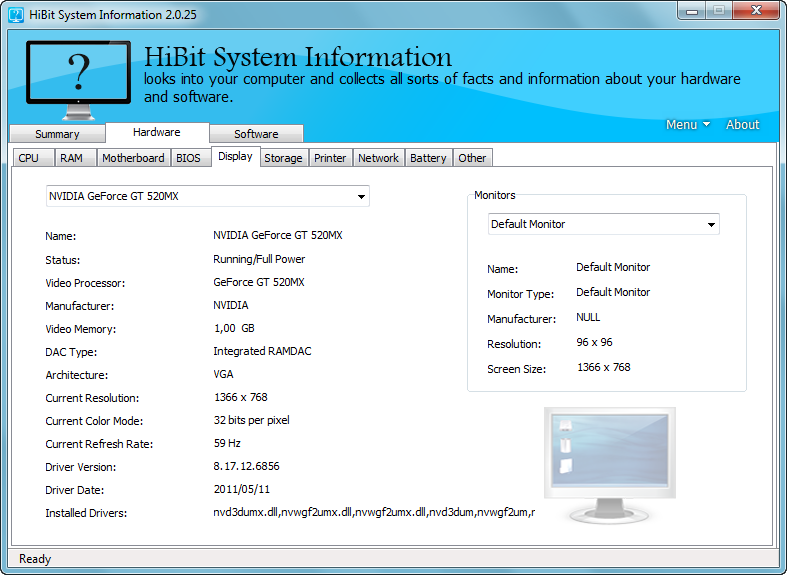
HiBit System Information - Extract details of all components of your computer.
Features:
- Detailed information about the configuration of your computer
- The storage device's health status
- The laptop battery health status
- List of running processes, services, drivers and startup
- List of installed software
- Export the computer information to the HTML file
- Easy-to-use user interface
- Automatic update to the latest version
Homepage: http://hibitsoft.ir/SystemInformation.html
Скачать: HiBit System Information v2.0.25
System Spec v3.11
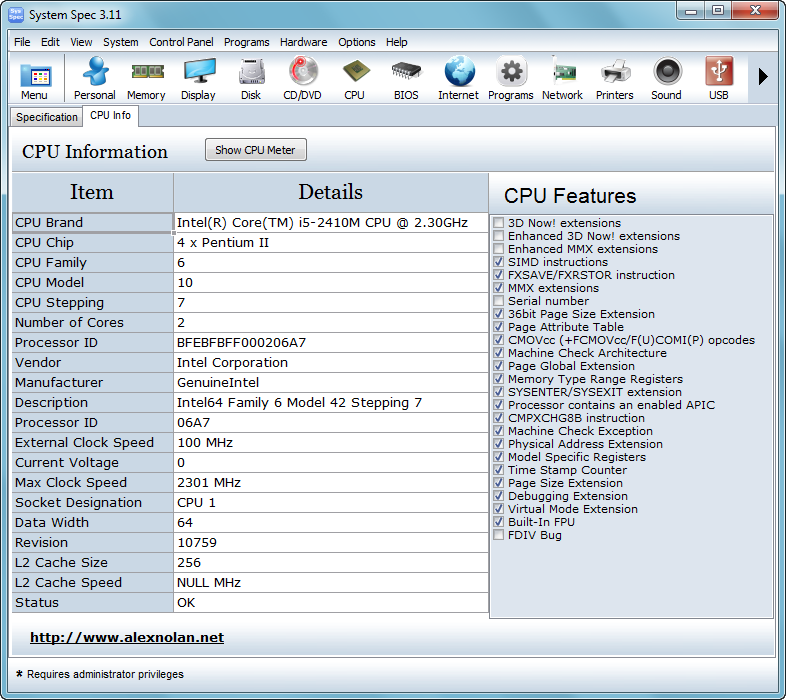
System Spec - gives you a complete specification and system information of your PC. This includes hardware, software and settings.
• What is System Spec?
System Spec is a freeware system information utility that produces a specification of your system's hardware and software.
With System Spec you can see, save and print a complete spec of your PC. This standalone, system information utility can also perform various windows functions. Additional advanced info includes CPU, drives, applications, display, memory, networking, internet, CD / DVD drives and more.
• Running System Spec
Make sure you have Administrator access when running System Spec because many items of system information require local administrator access rights for them to be retrieved. If you are not logged onto to Windows as Administrator or an account with administrator access, you can run as administrator by right clicking on of the SysSpec.exe and selecting the option.
Homepage: http://www.alexnolan.net/software/sysspec.htm
Скачать: System Spec v3.11
Другие версии программ:
Скачать: 3DP Chip v21.05
Скачать: 3DP Chip v21.12
Скачать: 3DP Chip v22.03
Скачать: 3DP Chip v22.04.1
Скачать: Core Temp v1.17.1
Скачать: CPU-Z v1.96.1
Скачать: CPU-Z v2.01
Скачать: TechPowerUp GPU-Z v2.40.0
Скачать: TechPowerUp GPU-Z v2.45.0
Скачать: GPU Caps Viewer v1.51.0.0
Скачать: GPU Caps Viewer v1.54.0.0
Скачать: GFXplorer v3.14.0.1660
Скачать: GFXplorer v3.15.1.1742
Скачать: Libre Hardware Monitor v0.8.9
Скачать: HWMonitor PRO v1.45
Скачать: HWMonitor PRO v1.46.1
Скачать: HWiNFO v7.04
Скачать: HWiNFO v7.22
Скачать: Free PC Audit v5.0.1210.87
Скачать: Free PC Audit v5.1.211.96
Скачать: System Information Viewer v5.57
Скачать: System Information Viewer v5.58
Скачать: System Information Viewer v5.62
Скачать: System Information Viewer v5.63
Скачать: CrystalDiskInfo v8.12.1
Скачать: CrystalDiskInfo v8.16.4
Скачать: CrystalDiskInfo v8.17.2
Скачать: GPU Shark v0.22.2.0
Скачать: GPU Shark v0.24.2.0
Скачать: GPU Shark v0.25.0.0
Скачать: HiBit System Information v2.0.30
Скачать: HiBit System Information v2.0.35
Другие схожие программы:
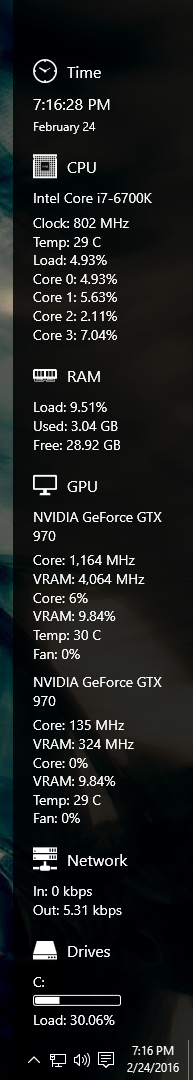
Скачать: Sidebar Diagnostics v3.5.9 [s] [?]
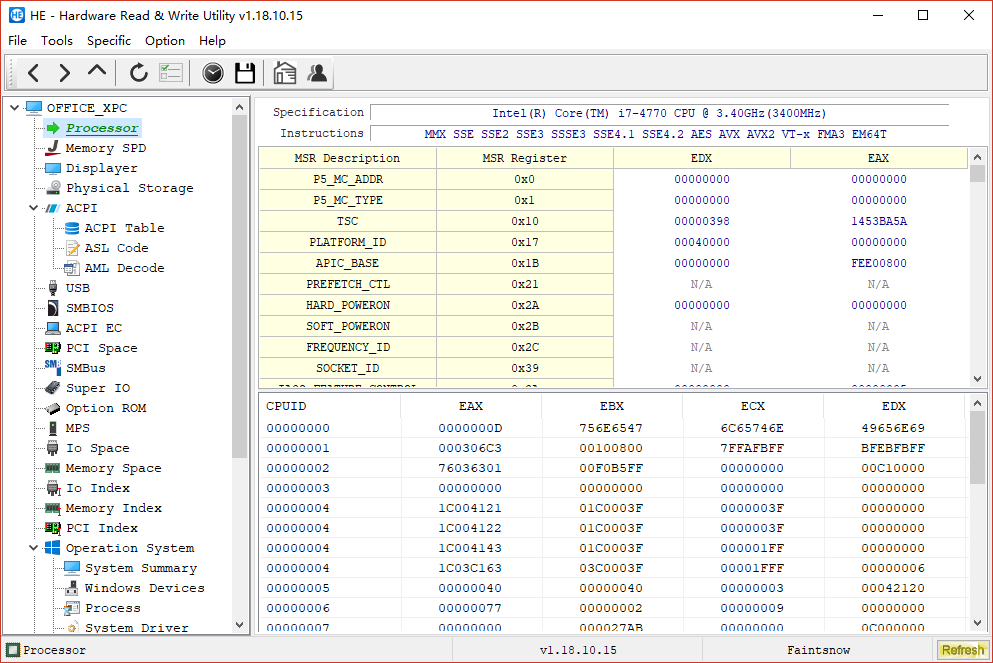
Скачать: HE - Hardware Read & Write Utility v1.21.3.5 [s] [?]
Скачать: HE - Hardware Read & Write Utility v1.21.6.4
Скачать: HE - Hardware Read & Write Utility v1.22.1.20
Скачать: HE - Hardware Read & Write Utility v1.22.4.11